NIO 34-day bearish forecast — Nov 15, 2026
- Bias: Bearish
- Timeframe: 34 days (made Nov 15, 2026, target date Dec 18, 2026)
- Price at analysis: $2.90
- Price target: $2.68
- Expected range: $2.25 – $3.30
- Result: Pending — graded after the close on Dec 18, 2026
Get a free AI analysis of NIO today
Analysis
TECHNICAL INDICATORS
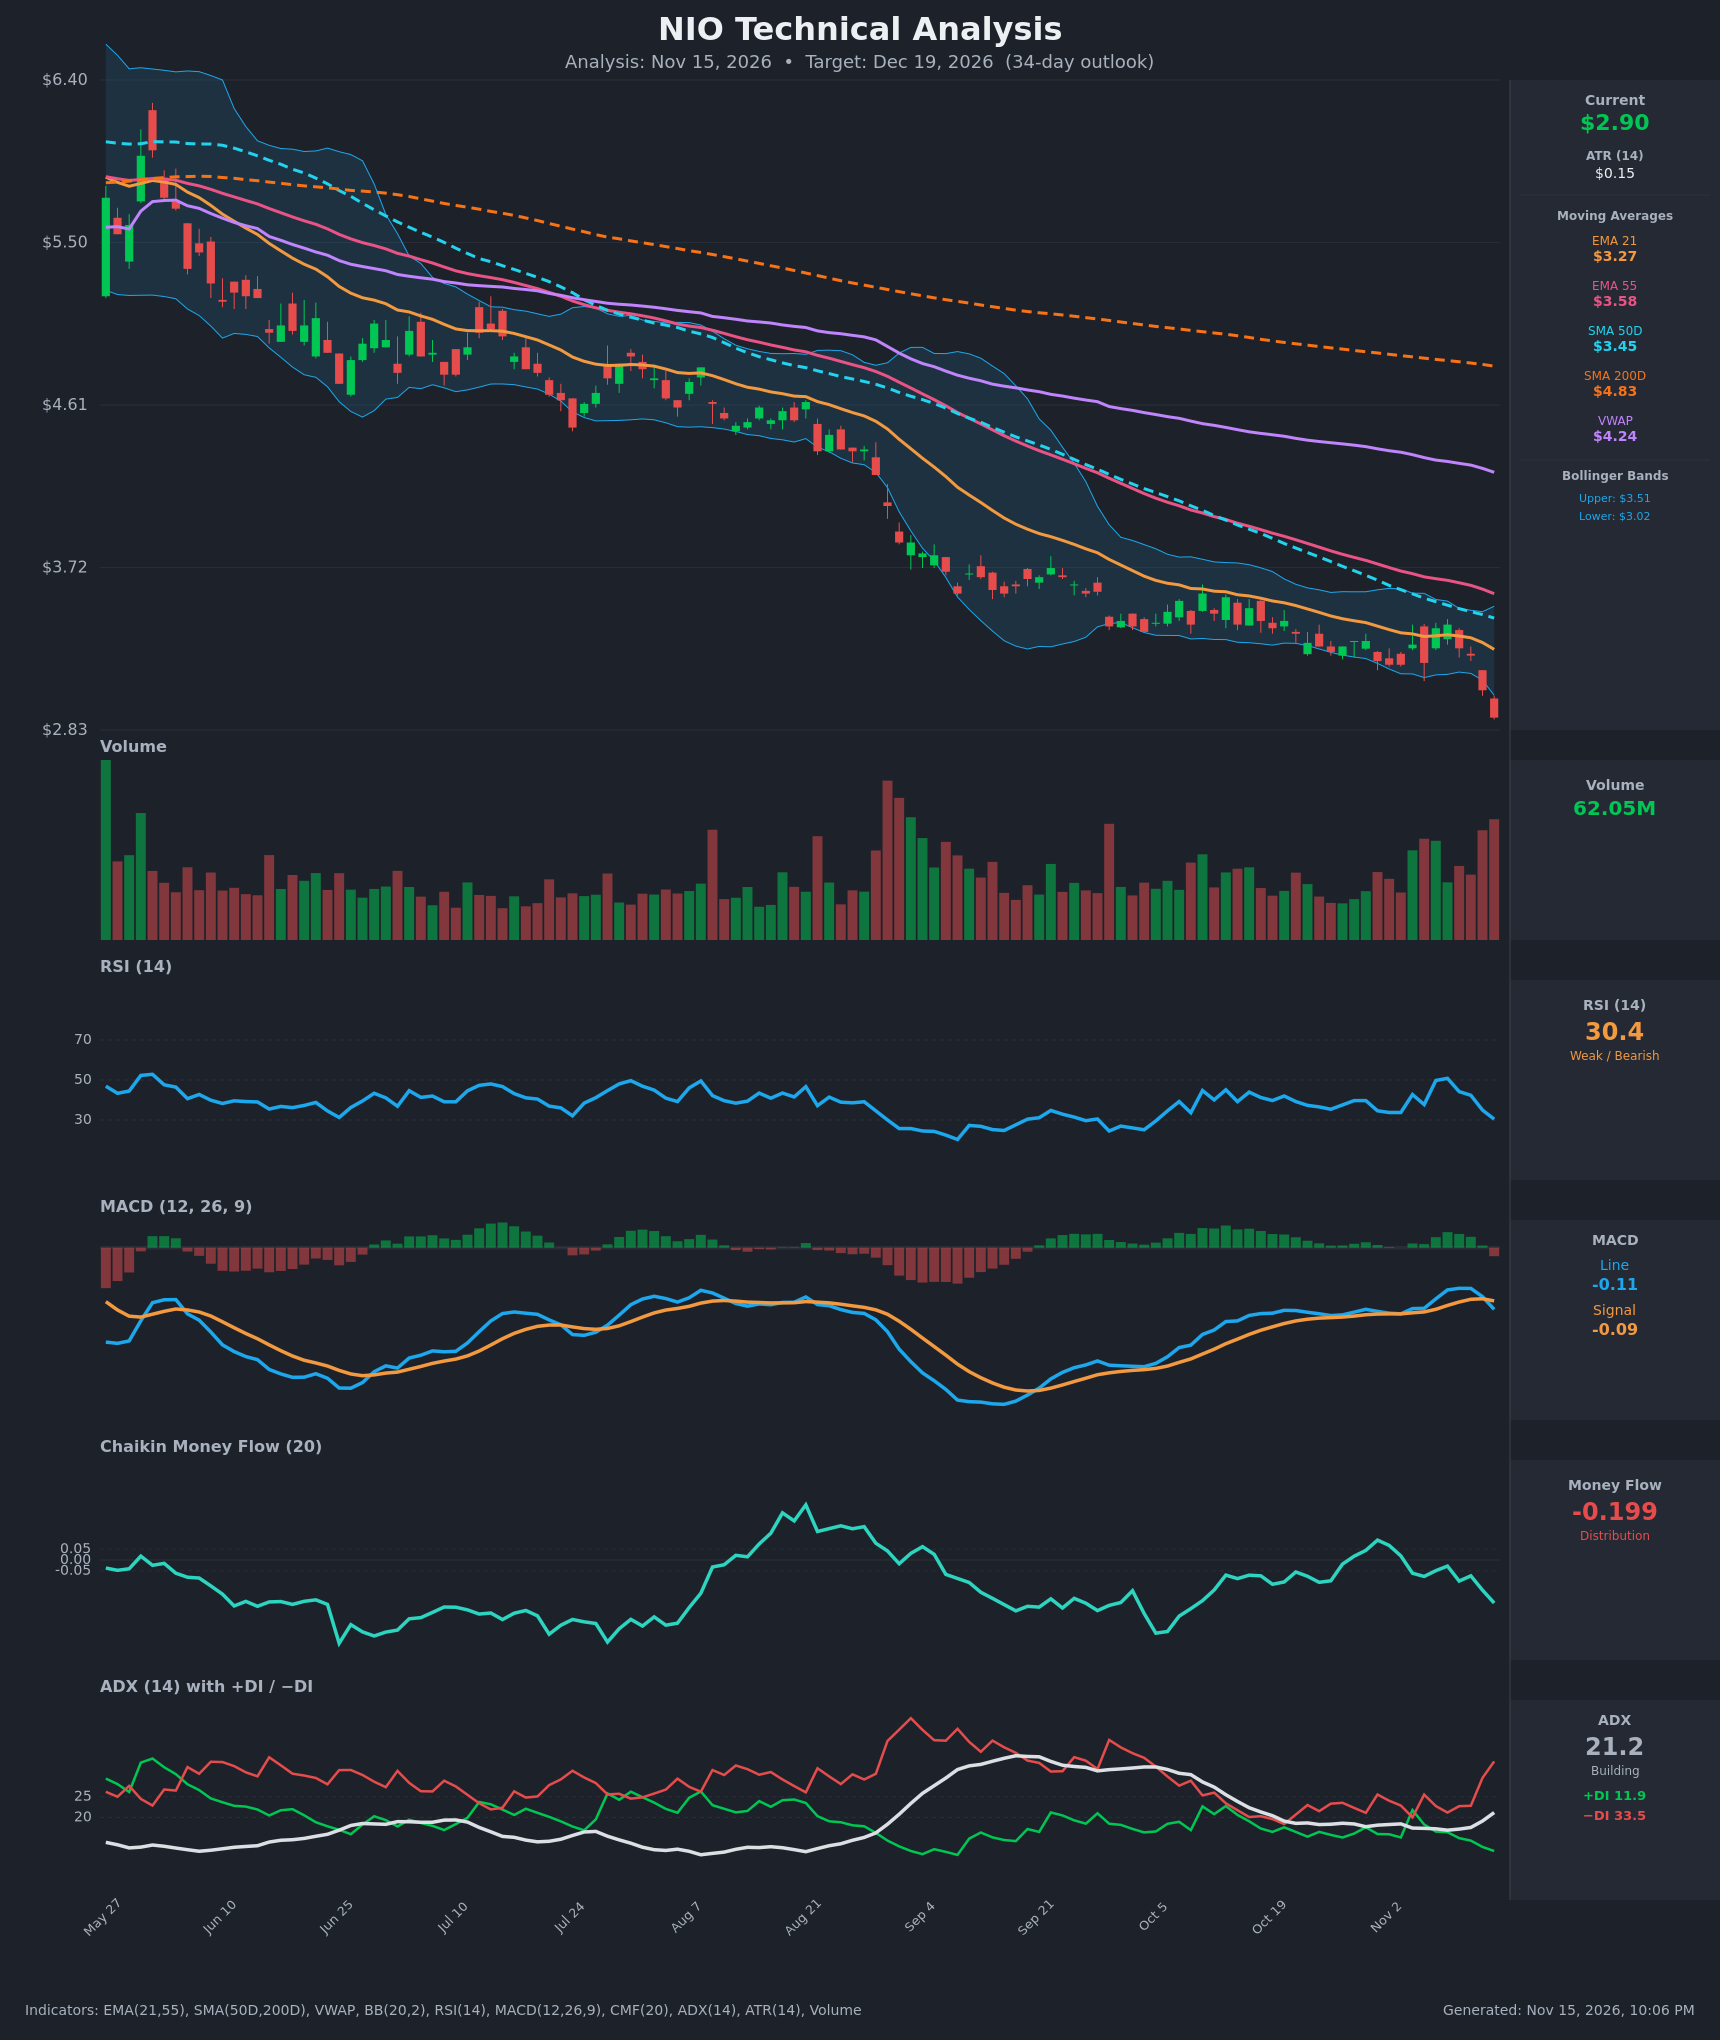
- RSI (14): 30.43, right at the oversold threshold after falling from ~50 on Nov 9 (50.8). Momentum is sharply down, but there is no bullish divergence yet. Oversold readings in a persistent downtrend can stay oversold. [Bearish]
- 20 EMA: The provided EMA 21 is $3.27 and price at $2.90 sits about 11% below it. The EMA is sloping down and acts as overhead resistance. EMA 21 is below EMA 55 ($3.58), a bearish alignment. [Bearish]
- MACD: Line -0.108 is below signal -0.093, so the bearish crossover just occurred (Nov 13), reversing the brief convergence. The histogram turned negative (~-0.015) after the positive spell. Momentum is rolling over again, with both lines below zero. [Bearish]
- Bollinger Bands (20): Upper $3.51, lower $3.02, midline ~$3.27. Price at $2.90 closed below the lower band, a breakdown or "band-walk" move after the bands had been narrowing. This is a bearish expansion, though it also raises the odds of a short-term snap-back toward the lower band. [Bearish]
- CMF (20): -0.199, well below -0.05. It has fallen from near 0 a week ago, showing accelerating distribution and selling pressure. [Distribution]
- ADX (14): 21.2 and rising, with -DI 33.5 far above +DI 11.9. The trend is just reaching strength, and the DI spread is wide and widening, so bears are in firm control. [Strong Trend Building – Bearish]
- Volume: 62.05M, among the higher recent bars, on a red candle breaking to new lows. Heavy volume on a downside break confirms the selling. [Bearish confirmation]
DIVERGENCES & TRENDS
- No bullish divergence: price made a new low ($2.90) and RSI (30.4), MACD and CMF all made lower readings alongside it, so the indicators confirm the price.
- Long-term structure is bearish: price is below SMA200D ($4.83), SMA50D ($3.45), VWAP ($4.24) and both EMAs. The SMA50D is already below the SMA200D (death cross in place), and EMA21 is below EMA55.
- The Nov 9 bounce to $3.41 (RSI 50.8) failed below the EMA21/EMA55 cluster. This lower high was followed by a fresh drop of about 15% in 4 sessions.
- ADX is rising from a low base with -DI expanding, which suggests the downtrend is accelerating after a period of choppy consolidation around $3.20-$3.40.
- The MACD re-crossed below signal and CMF is turning down again, both indicating fresh momentum to the downside.
CHART PATTERNS
- Over the last several months, price has formed a persistent downtrend of lower highs and lower lows, a bearish channel with no confirmed reversal pattern.
- The consolidation at $3.20-$3.50 from late Oct to mid Nov resembles a Bearish Flag/Rectangle continuation pattern. The Nov 13 close at $2.90 is a breakdown below that range's support (~$3.15-$3.20).
- Measured move: the range height of about $0.30 projected from $3.20 gives roughly $2.90, already reached. The prior leg-down measured move extends toward $2.60-$2.70.
- No bullish reversal pattern (double bottom, falling wedge) has completed, so a reversal is unconfirmed.
POTENTIAL SCENARIOS
- Scenario 1: Bearish Trend Continuation — Breakdown below the consolidation, with -DI dominant, distribution on CMF and heavy volume. Price grinds lower with only weak bounces toward the $3.05-$3.15 breakdown level. Trigger: failure to reclaim $3.05 and daily closes below $2.85. Target: $2.55-$2.65. Invalidation: daily close above $3.27 (EMA 21). (50% probability)
- Scenario 2: Bullish Oversold Bounce — RSI at 30 and price below the lower Bollinger Band lead to a mean-reversion rally toward the band and EMA 21, then a rejection. Trigger: a reversal candle with volume above $2.95 and RSI turning up. Target: $3.15-$3.30. Invalidation: close below $2.75. (30% probability)
- Scenario 3: Neutral Basing Range — Price stabilizes between $2.65 and $3.10 after the sell-off as selling exhausts. Trigger: low-volume sideways closes with ADX falling. Target: ~$2.85-$2.95. Invalidation: close outside $2.60-$3.15. (20% probability)
PRICE TARGETS
- Target Price: $2.68 (34-day horizon)
- Expected Range: $2.25 to $3.30 (width $1.05 ≈ 36% of current price; this is wider than the 12-18% formula suggests, chosen because NIO's ATR of $0.1486 (~5% daily) implies large 34-day volatility. Note that this exceeds the guideline band for 30-60 days, so a tighter alternative would be $2.40 to $3.10 (~24%))
- Key Levels: Support at $2.60, Resistance at $3.27
OVERALL BIAS
OVERALL BIAS: BEARISH - Price broke below its consolidation and the lower Bollinger Band on heavy volume, with MACD rolling over, CMF at -0.20 and -DI (33.5) far above +DI (11.9) as ADX rises, all below a bearish MA stack. The oversold RSI raises the risk of a bounce, but it will likely meet resistance at $3.05-$3.27.
This is educational analysis and not financial advice.