GLD 4-day bearish forecast — Oct 31, 2026
- Bias: Bearish
- Timeframe: 4 days (made Oct 31, 2026, target date Nov 3, 2026)
- Price at analysis: $355.96
- Price target: $352.00
- Expected range: $345.50 – $361.50
- Result: Incorrect (+1.0%) — closed at $359.42 on Nov 3, 2026; quality score 49/100
Get a free AI analysis of GLD today
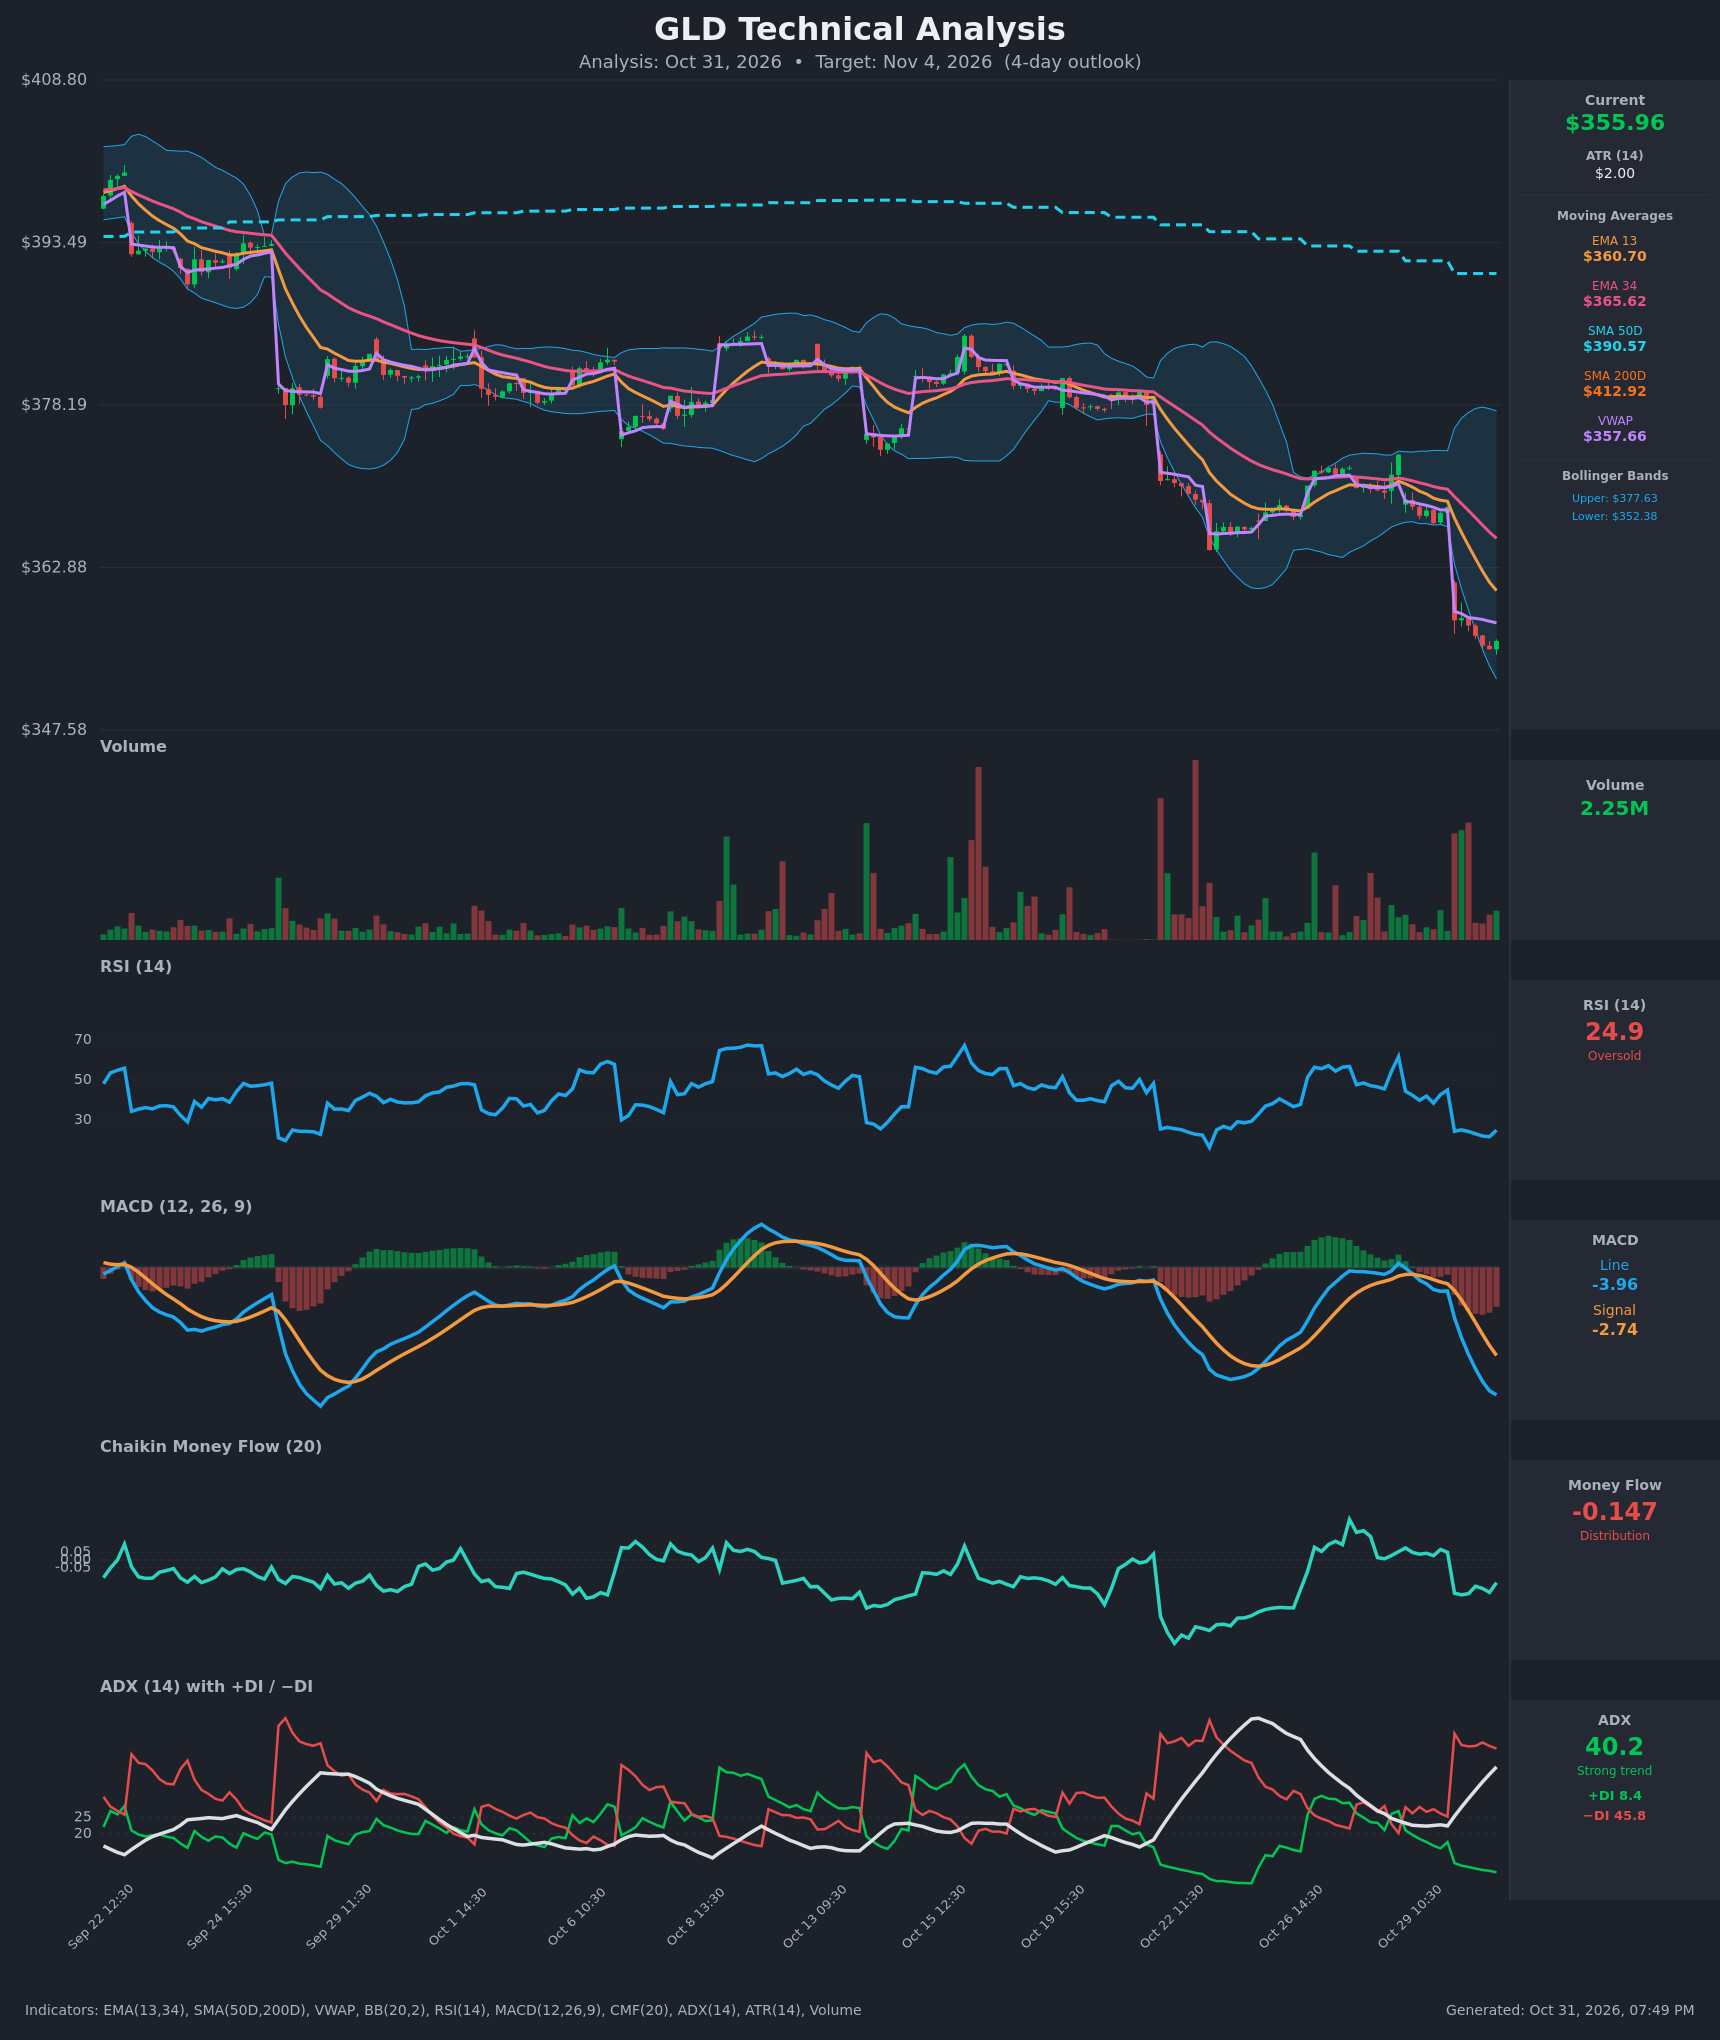
Analysis
TECHNICAL INDICATORS
- RSI (14): 24.94, oversold. It was 45 on Oct 29, collapsed to 21.6 after the Oct 30 gap down, and has ticked up slightly. Momentum is deeply negative, though a bounce is possible. [Bearish]
- 20 EMA (EMA 13 / EMA 34 used): Price of $355.96 is below EMA13 ($360.70) and EMA34 ($365.62), and both are sloping down. EMA13 is below EMA34, so both act as overhead resistance. [Bearish]
- MACD: Line -3.96 is below signal -2.74 and the gap is widening. The histogram is negative and expanding. The bearish crossover happened around Oct 29, and there is no sign of a turn yet. [Bearish]
- Bollinger Bands (20): Upper $377.63, lower $352.38. The bands are wide after the volatility spike. Price is in the lower part of the bands, about $3.60 above the lower band, and has been "walking" down it. Price is oversold relative to the bands, but trending moves can ride the lower band. [Bearish]
- CMF (20): -0.147, well below -0.05. It dropped from about +0.05 to about -0.2 on the gap down and shows sustained selling pressure. [Distribution]
- ADX (14): 40.2 and rising sharply from 22. −DI at 45.8 is far above +DI at 8.4. This is a strong, bear-controlled trend. [Strong Trend – Bearish]
- Volume: 2.25M. Volume was heavy on the gap-down bars (red spikes) and is average on the latest bar. Selling was decisive, but there is no capitulation spike yet. Price is also below VWAP ($357.66). [Bearish]
DIVERGENCES & TRENDS
- There is no bullish divergence yet. The RSI low of 21.6 matches the price low, so momentum confirms the price decline.
- The MA stack is fully bearish: price < EMA13 < EMA34 < SMA50D ($390.57) < SMA200D ($412.92). Price is about 14% below the SMA200D, and the SMA50D is below the SMA200D (a death cross already in force).
- The MACD bearish crossover is confirmed and diverging. ADX is rising above 40 with −DI dominant. The DI spread is at an extreme.
- Price sits below VWAP, and CMF has been negative since the Oct 30 gap.
- The stretched reading (RSI ~25, price far below every MA) raises the odds of a relief bounce toward the EMA13 and VWAP. A bounce would still fit the downtrend.
CHART PATTERNS
- The chart shows a staircase of gap-down legs since September: Oct 22 and Oct 30 are the latest. This resembles a Bearish Rising Wedge / Bearish Flag continuation at a larger scale, where each consolidation resolved lower.
- There is no confirmed reversal pattern. A bullish falling wedge or double bottom would need a higher low and a break above ~$361–$366.
- Measured-move logic from the gap-and-pause behavior suggests continuation toward the $345–$350 area if the $352 band support fails.
POTENTIAL SCENARIOS
- Scenario 1: Bearish Trend Continuation — Strong ADX, −DI dominance, a widening MACD gap and distribution keep sellers in control, and price pushes through the lower Bollinger Band. Trigger: Break and hourly close below $352.38. Target: $350.00, then $346–$347. Invalidation: Hourly close above $360.70 (EMA13). (50% probability)
- Scenario 2: Bullish Oversold Relief Bounce — RSI near 25 and price near the lower band prompt a mean-reversion rally toward the EMA13 and VWAP. Trigger: Reclaim of VWAP at $357.66 with rising volume. Target: $360.70, with an extension to $363. Invalidation: Failure at $360–$361 and a fall back below $355. (35% probability)
- Scenario 3: Neutral Basing Range — Price chops between the lower band and VWAP as the selling pauses. Trigger: Holding $352.50–$358. Target: $355–$357. Invalidation: Close outside $352 or $361. (15% probability)
PRICE TARGETS
- Target Price: $352.00 (4-day horizon)
- Expected Range: $345.50 to $361.50 (width $16.00, about 4.5% of current price, scaled for 4 days)
- Key Levels: Support at $350.00 (the lower Bollinger Band at $352.38 is the first line), Resistance at $360.70 (EMA13, then VWAP at $357.66 along the way)
OVERALL BIAS
OVERALL BIAS: BEARISH - A strong ADX of 40 with −DI far above +DI, a widening bearish MACD, distribution on CMF, and price below every key moving average and VWAP favor continuation. Oversold RSI raises the risk of a bounce, so conviction is moderate.
This is educational analysis and not financial advice.