GLD 83-day bearish forecast — Nov 15, 2026
- Bias: Bearish
- Timeframe: 83 days (made Nov 15, 2026, target date Feb 5, 2027)
- Price at analysis: $355.45
- Price target: $343.00
- Expected range: $305.00 – $385.00
- Result: Pending — graded after the close on Feb 5, 2027
Get a free AI analysis of GLD today
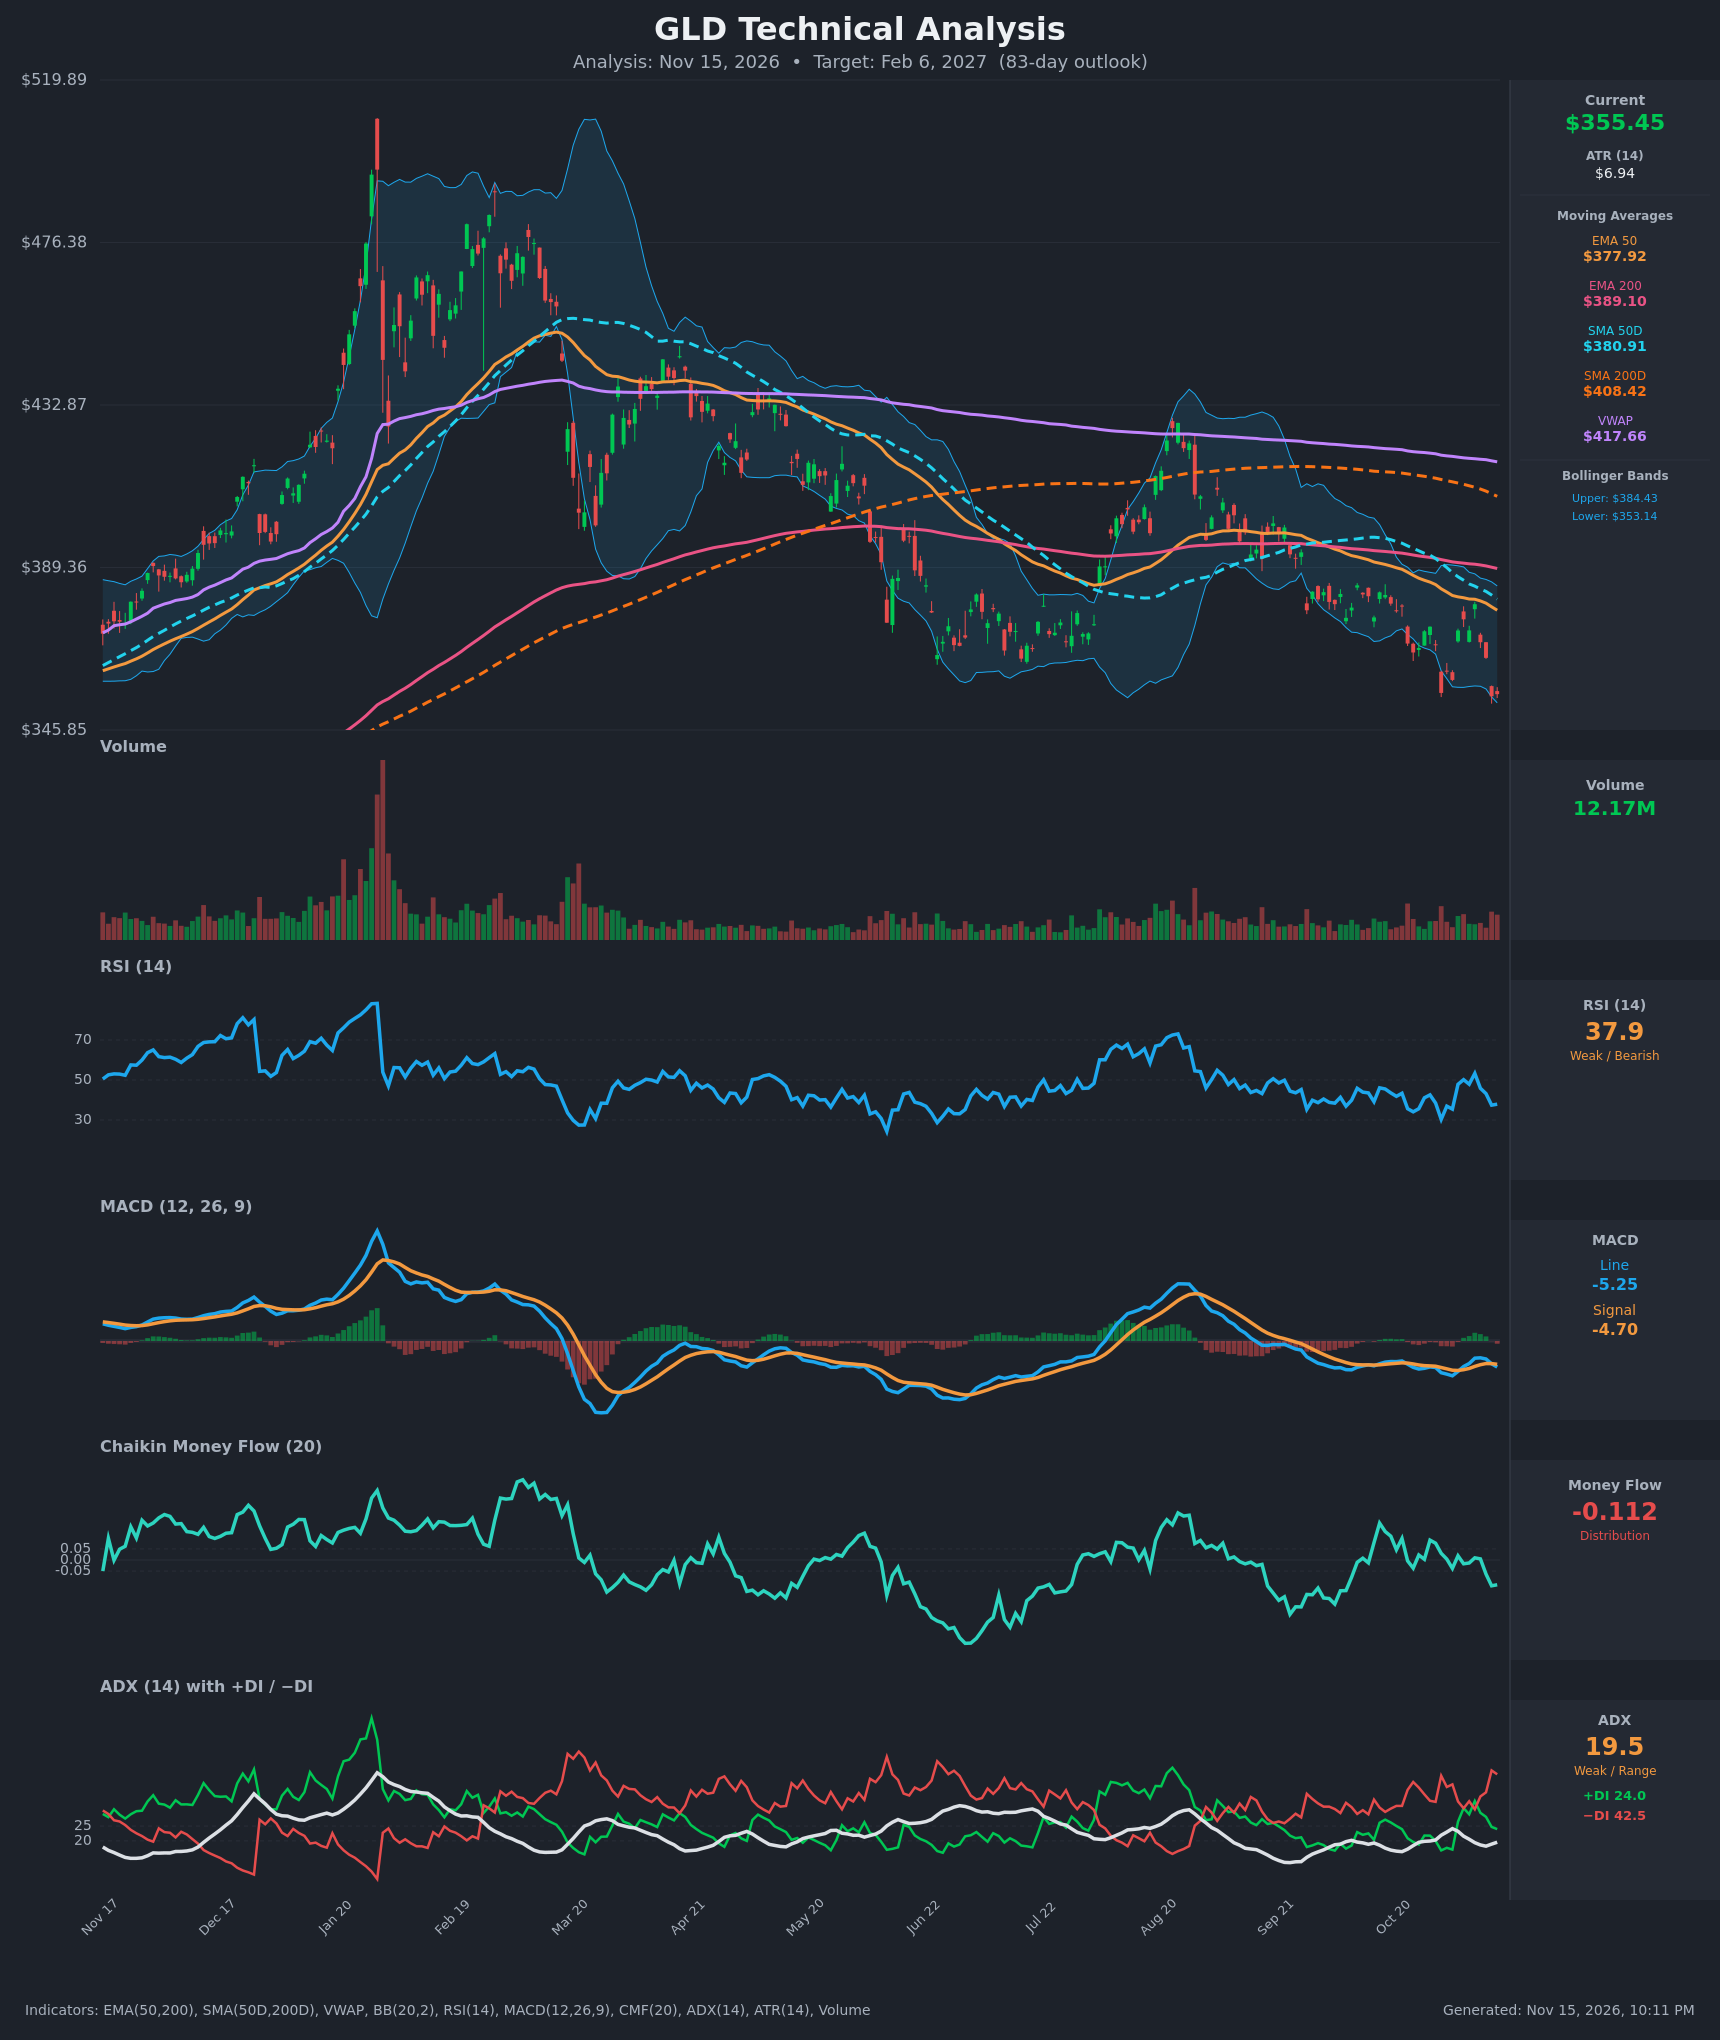
Analysis
TECHNICAL INDICATORS
- RSI (14): 37.9, in the weak/bearish zone but not oversold (<30). It bounced to ~53 on Nov 9 and has rolled over to 37.9, a lower high in momentum. It has not made a new low like price has. [Bearish]
- 20 EMA: The 20 EMA isn't supplied. The 50 EMA at $377.92 and 200 EMA at $389.10 both sit above price and are sloping down, and the 50 EMA is below the 200 EMA. Price is about 6% under the 50 EMA, which acts as dynamic resistance. [Bearish]
- MACD: Line -5.25 is below signal -4.70, and the histogram is negative again after a brief bullish cross attempt on Nov 9-10. The re-cross lower from -3.4 to -5.25 shows momentum failing. Both lines are below zero. [Bearish]
- Bollinger Bands (20): Price at $355.45 is hugging the lower band ($353.14), with the upper band at $384.43 and the midline near $369. Walking the lower band signals a persistent downtrend. The bands are narrowing, so a short-term bounce toward the midline is possible, but there is no squeeze breakout to the upside. [Bearish]
- CMF (20): -0.112, below the -0.05 threshold. It slid from roughly flat/positive (+0.09 on Oct 28) to clear distribution, so sellers are gaining control. [Distribution]
- ADX (14): 19.5 (weak/borderline) with −DI at 42.5 far above +DI at 24.0. The trend is not yet strong, but directional pressure is clearly bearish and ADX is ticking up from 18.2. [Weak Trend, Bearish Direction]
- Volume: 12.17M, average and unremarkable. There is no capitulation spike, so no exhaustion signal yet. Recent red candles on slightly elevated volume support the downside bias. [Neutral to Mildly Bearish]
DIVERGENCES & TRENDS
- Price at $355.45 is at or near the lowest level on the chart (the Oct 30 low was $355.78 and Nov 12 was $354.89). RSI, at 37.9, is not near its prior extremes (~25-30), so there is no bullish divergence. RSI is merely tracking price lower.
- The death cross is already in place. SMA50D ($380.91) is below SMA200D ($408.42), and the gap is widening. EMA50 is below EMA200 too. Price is below every moving average and below VWAP ($417.66), so it is a long-term downtrend.
- Price has made a series of lower highs: the January spike near $510, then ~$490 in February, ~$430 in August, and ~$380 now. The June-July lows near $365 have been broken.
- MACD crossed bullish on Nov 9 and then reversed back below signal by Nov 12. That whipsaw is a failed bullish crossover and bearish confirmation.
- CMF fell from +0.09 to -0.112 while price sank. Distribution is confirming the price move.
- −DI has swung back above +DI by ~18 points, so bears dominate. ADX is below 20 though, so this is not yet a strongly trending market.
CHART PATTERNS
- The dominant structure is a long-term descending channel / lower-highs sequence after the blow-off top. It resembles a bearish rising-wedge/expanding reversal on the big picture, with the lower highs from the parabolic spike marking a topping process that has now resolved lower.
- Near term, the Oct-Nov bounces between ~$355 and ~$379 look like a bearish flag/descending-triangle-like consolidation with a flat support zone near $355. A close below that zone projects a measured move of roughly the pattern height (~$25) to about $330.
- A bullish alternative is a falling wedge if price stabilizes at the lower band. This needs a close back above the $375-$380 cluster (50 EMA) to be actionable, and it is not confirmed.
POTENTIAL SCENARIOS
- Scenario 1: Bearish Breakdown Continuation — Price loses the $354-355 support zone and keeps trending lower with −DI dominant, MACD negative and CMF in distribution, in line with the pattern's measured move. Trigger: daily close below $353 (lower band / Nov 12 low). Target: $340-$345 initially, then $320-$330 over the 83 days. Invalidation: daily close above $378 (50 EMA). (55% probability)
- Scenario 2: Bullish Mean-Reversion Bounce — Price stalls at the lower band and RSI approaches oversold, so a relief rally runs back to the moving averages, as happened after prior oversold dips. Trigger: close above $366 with a MACD bullish crossover and CMF back above 0. Target: $378-$385 (50 EMA / upper band), with a possible stretch to $390 (200 EMA). Invalidation: close below $350. (30% probability)
- Scenario 3: Neutral Range Consolidation — Price chops between $345 and $375 as ADX stays under 20 and momentum stays muted. Trigger: repeated failures on both sides of that band. Target: $355-$365. Invalidation: close outside $343-$378. (15% probability)
PRICE TARGETS
- Target Price: $343.00 (83 days, about Feb 6, 2027)
- Expected Range: $305.00 to $385.00 (width $80, ≈22.5% of current price, consistent with the 61-180 day guidance)
- Key Levels: Support at $345.00, Resistance at $375.50
OVERALL BIAS
OVERALL BIAS: BEARISH - Price is below every moving average and VWAP with a death cross in place, −DI far above +DI, a MACD re-cross lower, and CMF in distribution while price walks the lower Bollinger Band. The main risk is a mean-reversion bounce toward the $378 50 EMA, since RSI is not yet oversold and ADX is weak.
This is educational analysis and not financial advice.