GLD 34-day bearish forecast — Nov 15, 2026
- Bias: Bearish
- Timeframe: 34 days (made Nov 15, 2026, target date Dec 18, 2026)
- Price at analysis: $355.45
- Price target: $349.00
- Expected range: $330.00 – $373.00
- Result: Pending — graded after the close on Dec 18, 2026
Get a free AI analysis of GLD today
Analysis
TECHNICAL INDICATORS
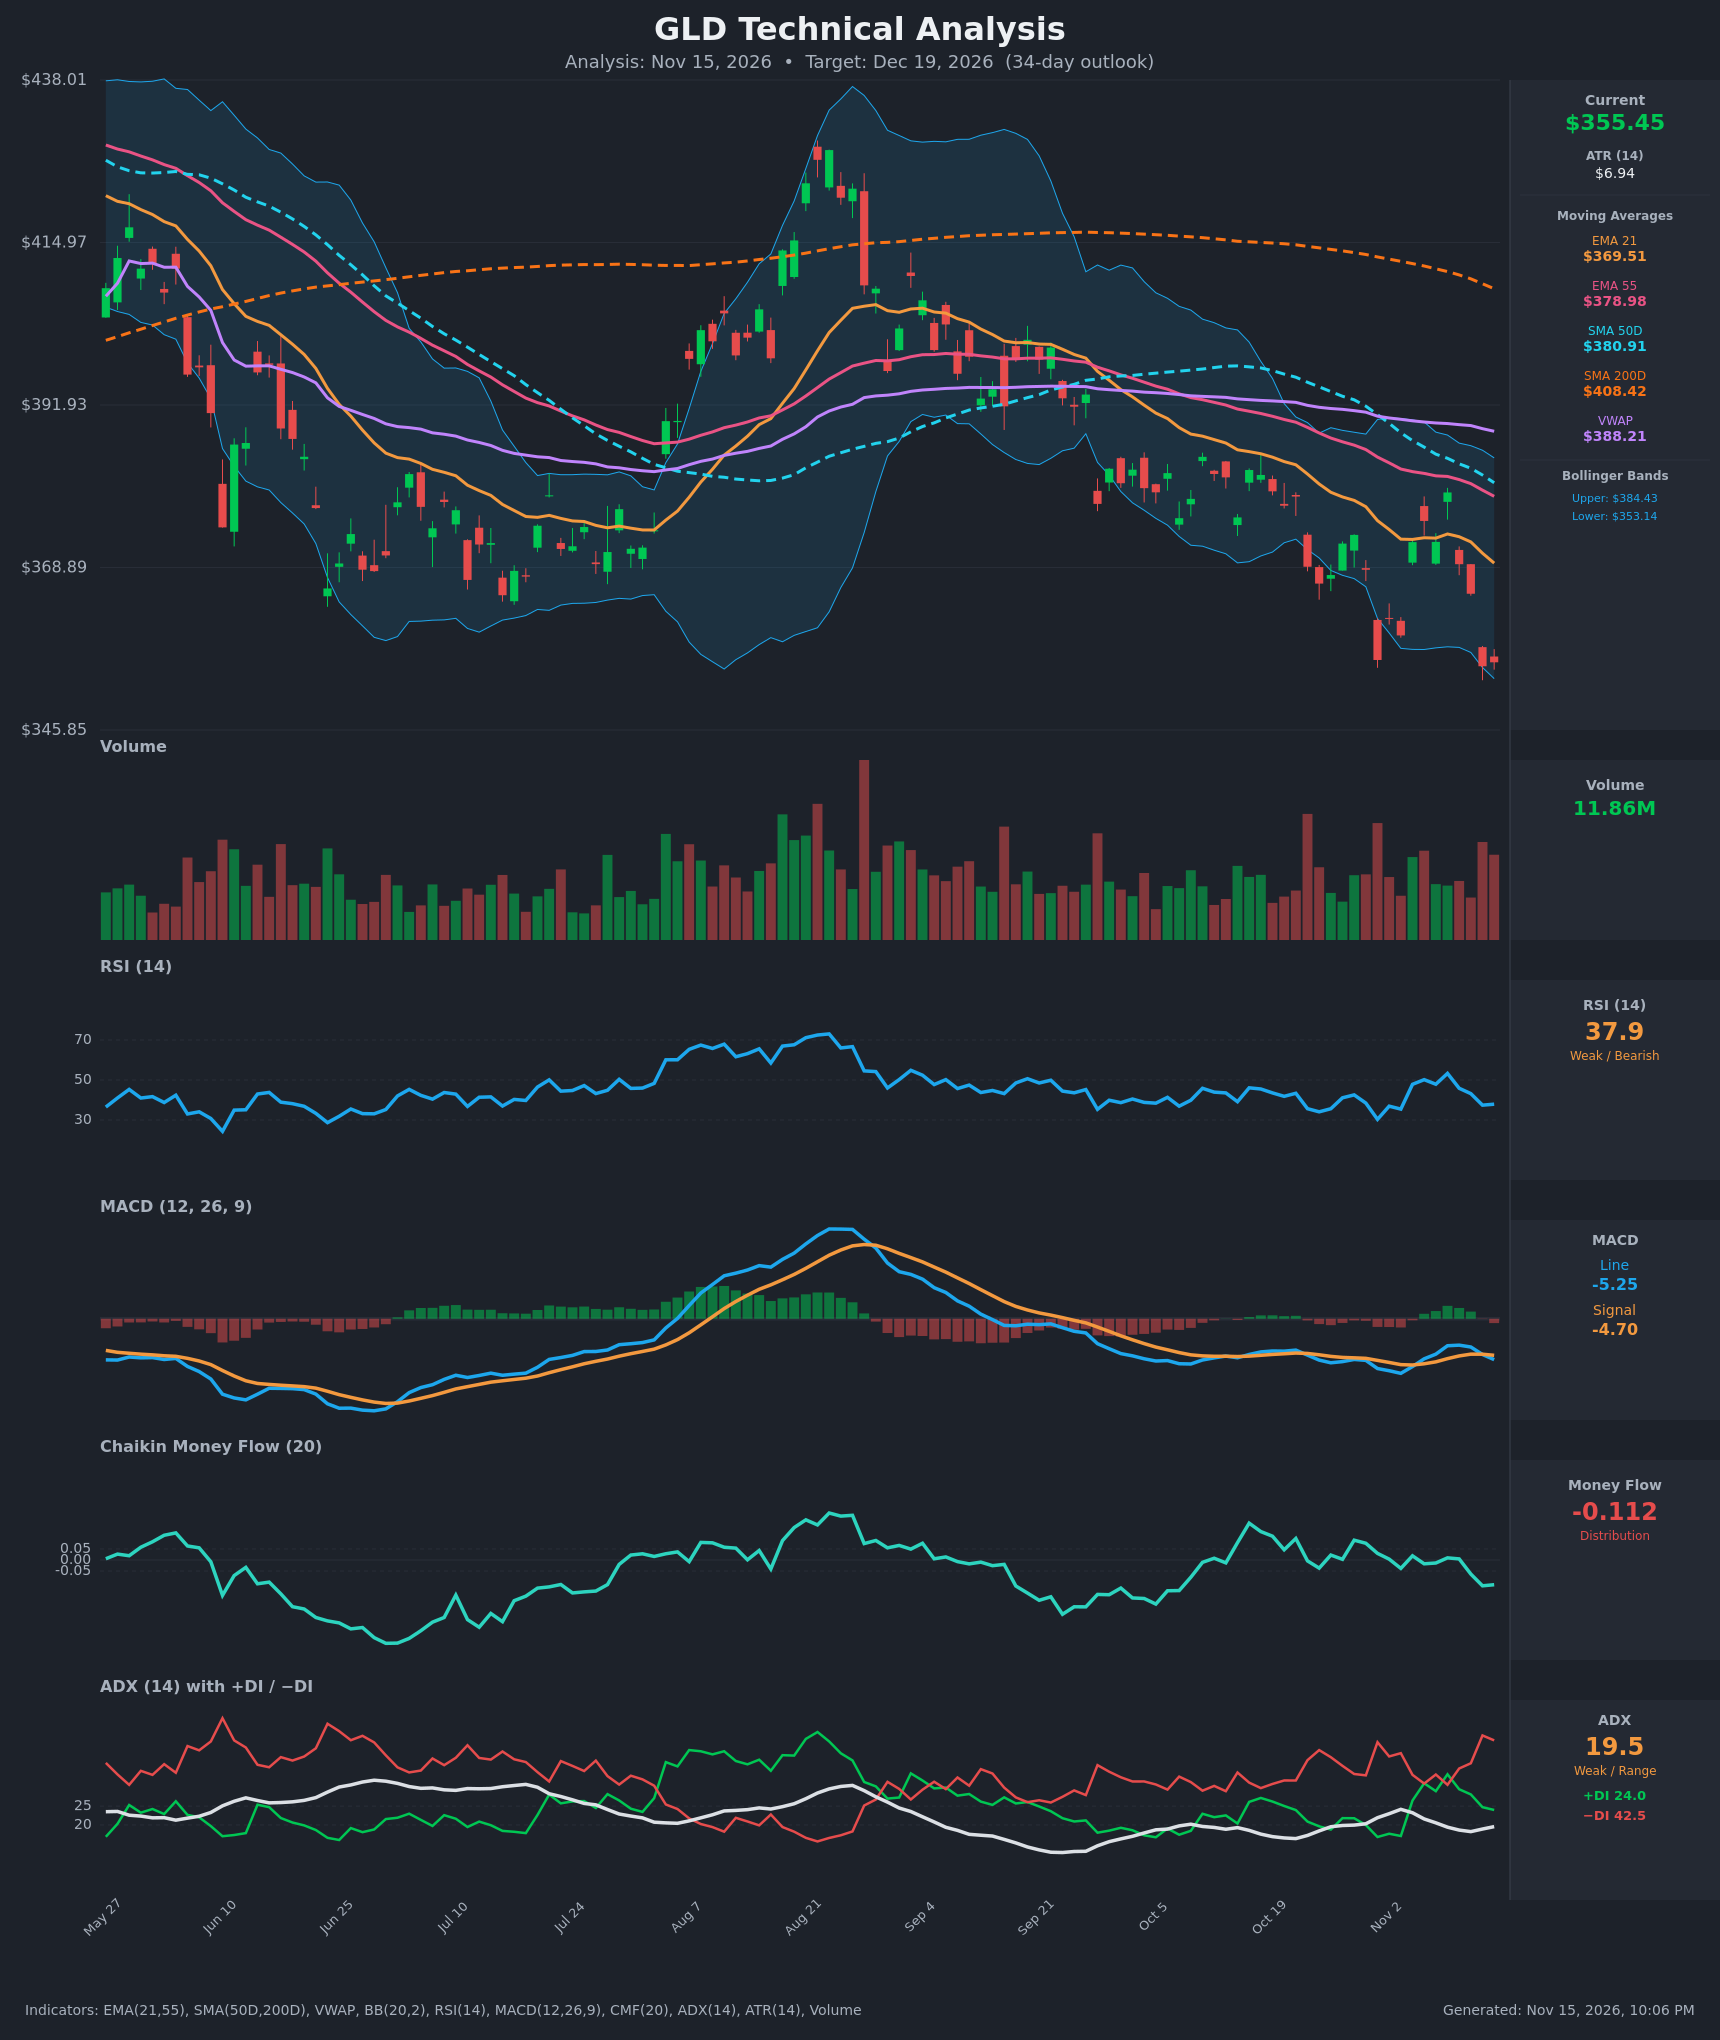
- RSI (14): 37.91, below neutral 50 but not oversold. It fell from 53.3 on Nov 9 to 37.9 and has made lower highs since the August peak near 70. Momentum is weak, with a pullback toward the 30 zone possible. [Bearish]
- 20 EMA: The 21 EMA is $369.51 and price at $355.45 is about 3.8% below it, so it acts as overhead resistance. The EMA21 has sat below EMA55 ($378.98) for a while, and both are sloping down. [Bearish]
- MACD: The line is -5.25, below the signal at -4.70. It crossed back down on Nov 13, after a brief bullish attempt on Nov 9-10. The histogram has turned negative (about -0.56). The line has stayed below zero for months with no sustained recovery. [Bearish]
- Bollinger Bands (20): Upper $384.43, lower $353.14, so price is hugging the lower band (about 7% of the band width above it). Recent candles walk the lower band, which signals a downtrend. A band-walk can also exhaust into a snap-back toward the mid-band near $369. [Bearish]
- CMF (20): -0.112, below the -0.05 threshold and falling from positive readings in late October. This is distribution, with selling pressure increasing. [Distribution]
- ADX (14): 19.5, weak and range-like, but turning up from ~18. −DI at 42.5 is far above +DI at 24.0, so the bears control direction. The trend is not yet strong, but the DI spread favors downside. [Weak Trend, Bearish Direction]
- Volume: 11.86M, a heavy red bar on the latest decline, with recent down days showing larger volume than up days. This is consistent with distribution and a break to new lows. [Bearish confirmation]
DIVERGENCES & TRENDS
- Moving-average structure: Price is below EMA21 ($369.51), EMA55 ($378.98), SMA50D ($380.91), SMA200D ($408.42) and VWAP ($388.21). SMA50D is below SMA200D, a death-cross configuration, so the long-term trend is down.
- Price vs RSI: Price made a new low at $354.89-$355.45, below the Oct 30 low of $355.78. RSI is 37.9 against 30.3 at that earlier low, a mild bullish divergence. It is not confirmed, though, since MACD and CMF are weakening.
- MACD: It crossed below the signal on Nov 12-13 after a failed push toward zero, which is a bearish continuation signal.
- CMF: It has rolled from slightly positive to -0.112, the lowest since early in the period, so money flow is deteriorating.
- ADX/DI: −DI re-crossed far above +DI after a brief near-convergence on Nov 9, so bears have regained control.
- Trend: Lower highs across the chart (Nov 9 $379.53 vs Oct 28 $373.51 vs the August peak above $425) show a sequence of lower highs since August.
CHART PATTERNS
- Bearish Rising Wedge / descending channel: Price has been making lower highs and lower lows since the late-August top. This is closest to a downtrend channel rather than a clean textbook pattern.
- Bearish Double Top / Head and Shoulders (macro): The June and August peaks, followed by a break of the September-October support near $370, resemble a broad topping structure. Measured, this implies further downside.
- Support test: The Oct 30 and Nov 12 lows near $355 form a mini double bottom. A bounce is possible, but it needs a close above $370-$373 to confirm. Without that, a break below $354 opens a measured move toward $340-$345.
- Targets: The ATR is $6.94. A 34-day move of roughly 1.5 to 2 ATR-scaled swings points to $340-$345 on a breakdown and $370-$375 on a bounce.
POTENTIAL SCENARIOS
- Scenario 1: Bearish Continuation Lower — Price breaks the $353-$355 support and band-walk, with −DI dominant, CMF negative and MACD below signal. Trigger: daily close below $353.00 on heavy volume. Target: $338-$345. Invalidation: close above $370 (EMA21). (50% probability)
- Scenario 2: Bullish Oversold Bounce — The RSI divergence and lower-band support produce a mean-reversion bounce toward the mid-band and EMA21, then it stalls below SMA50D. Trigger: close above $362 followed by $370. Target: $369-$378. Invalidation: close below $350. (30% probability)
- Scenario 3: Neutral Range Consolidation — Price chops between $345 and $370 as ADX stays below 20. Trigger: failure to break either side for several weeks. Target: $352-$362. Invalidation: close outside $343-$372. (20% probability)
PRICE TARGETS
- Target Price: $349.00 (34-day timeframe, Dec 19)
- Expected Range: $330.00 to $373.00 (width $43, about 12.1% of current price, in line with 30-60 day guidance)
- Key Levels: Support at $345.85, Resistance at $369.51
OVERALL BIAS
OVERALL BIAS: BEARISH - Price is below all key moving averages with a death-cross structure, −DI dominates +DI (42.5 vs 24.0), MACD is back under its signal, and CMF shows distribution on rising volume. The RSI divergence tempers conviction, so a bounce toward $369 is possible, but the path of least resistance is lower.
This is educational analysis and not financial advice.