GLD 27-day bearish forecast — Nov 15, 2026
- Bias: Bearish
- Timeframe: 27 days (made Nov 15, 2026, target date Dec 11, 2026)
- Price at analysis: $355.45
- Price target: $347.00
- Expected range: $326.00 – $376.00
- Result: Pending — graded after the close on Dec 11, 2026
Get a free AI analysis of GLD today
Analysis
TECHNICAL INDICATORS
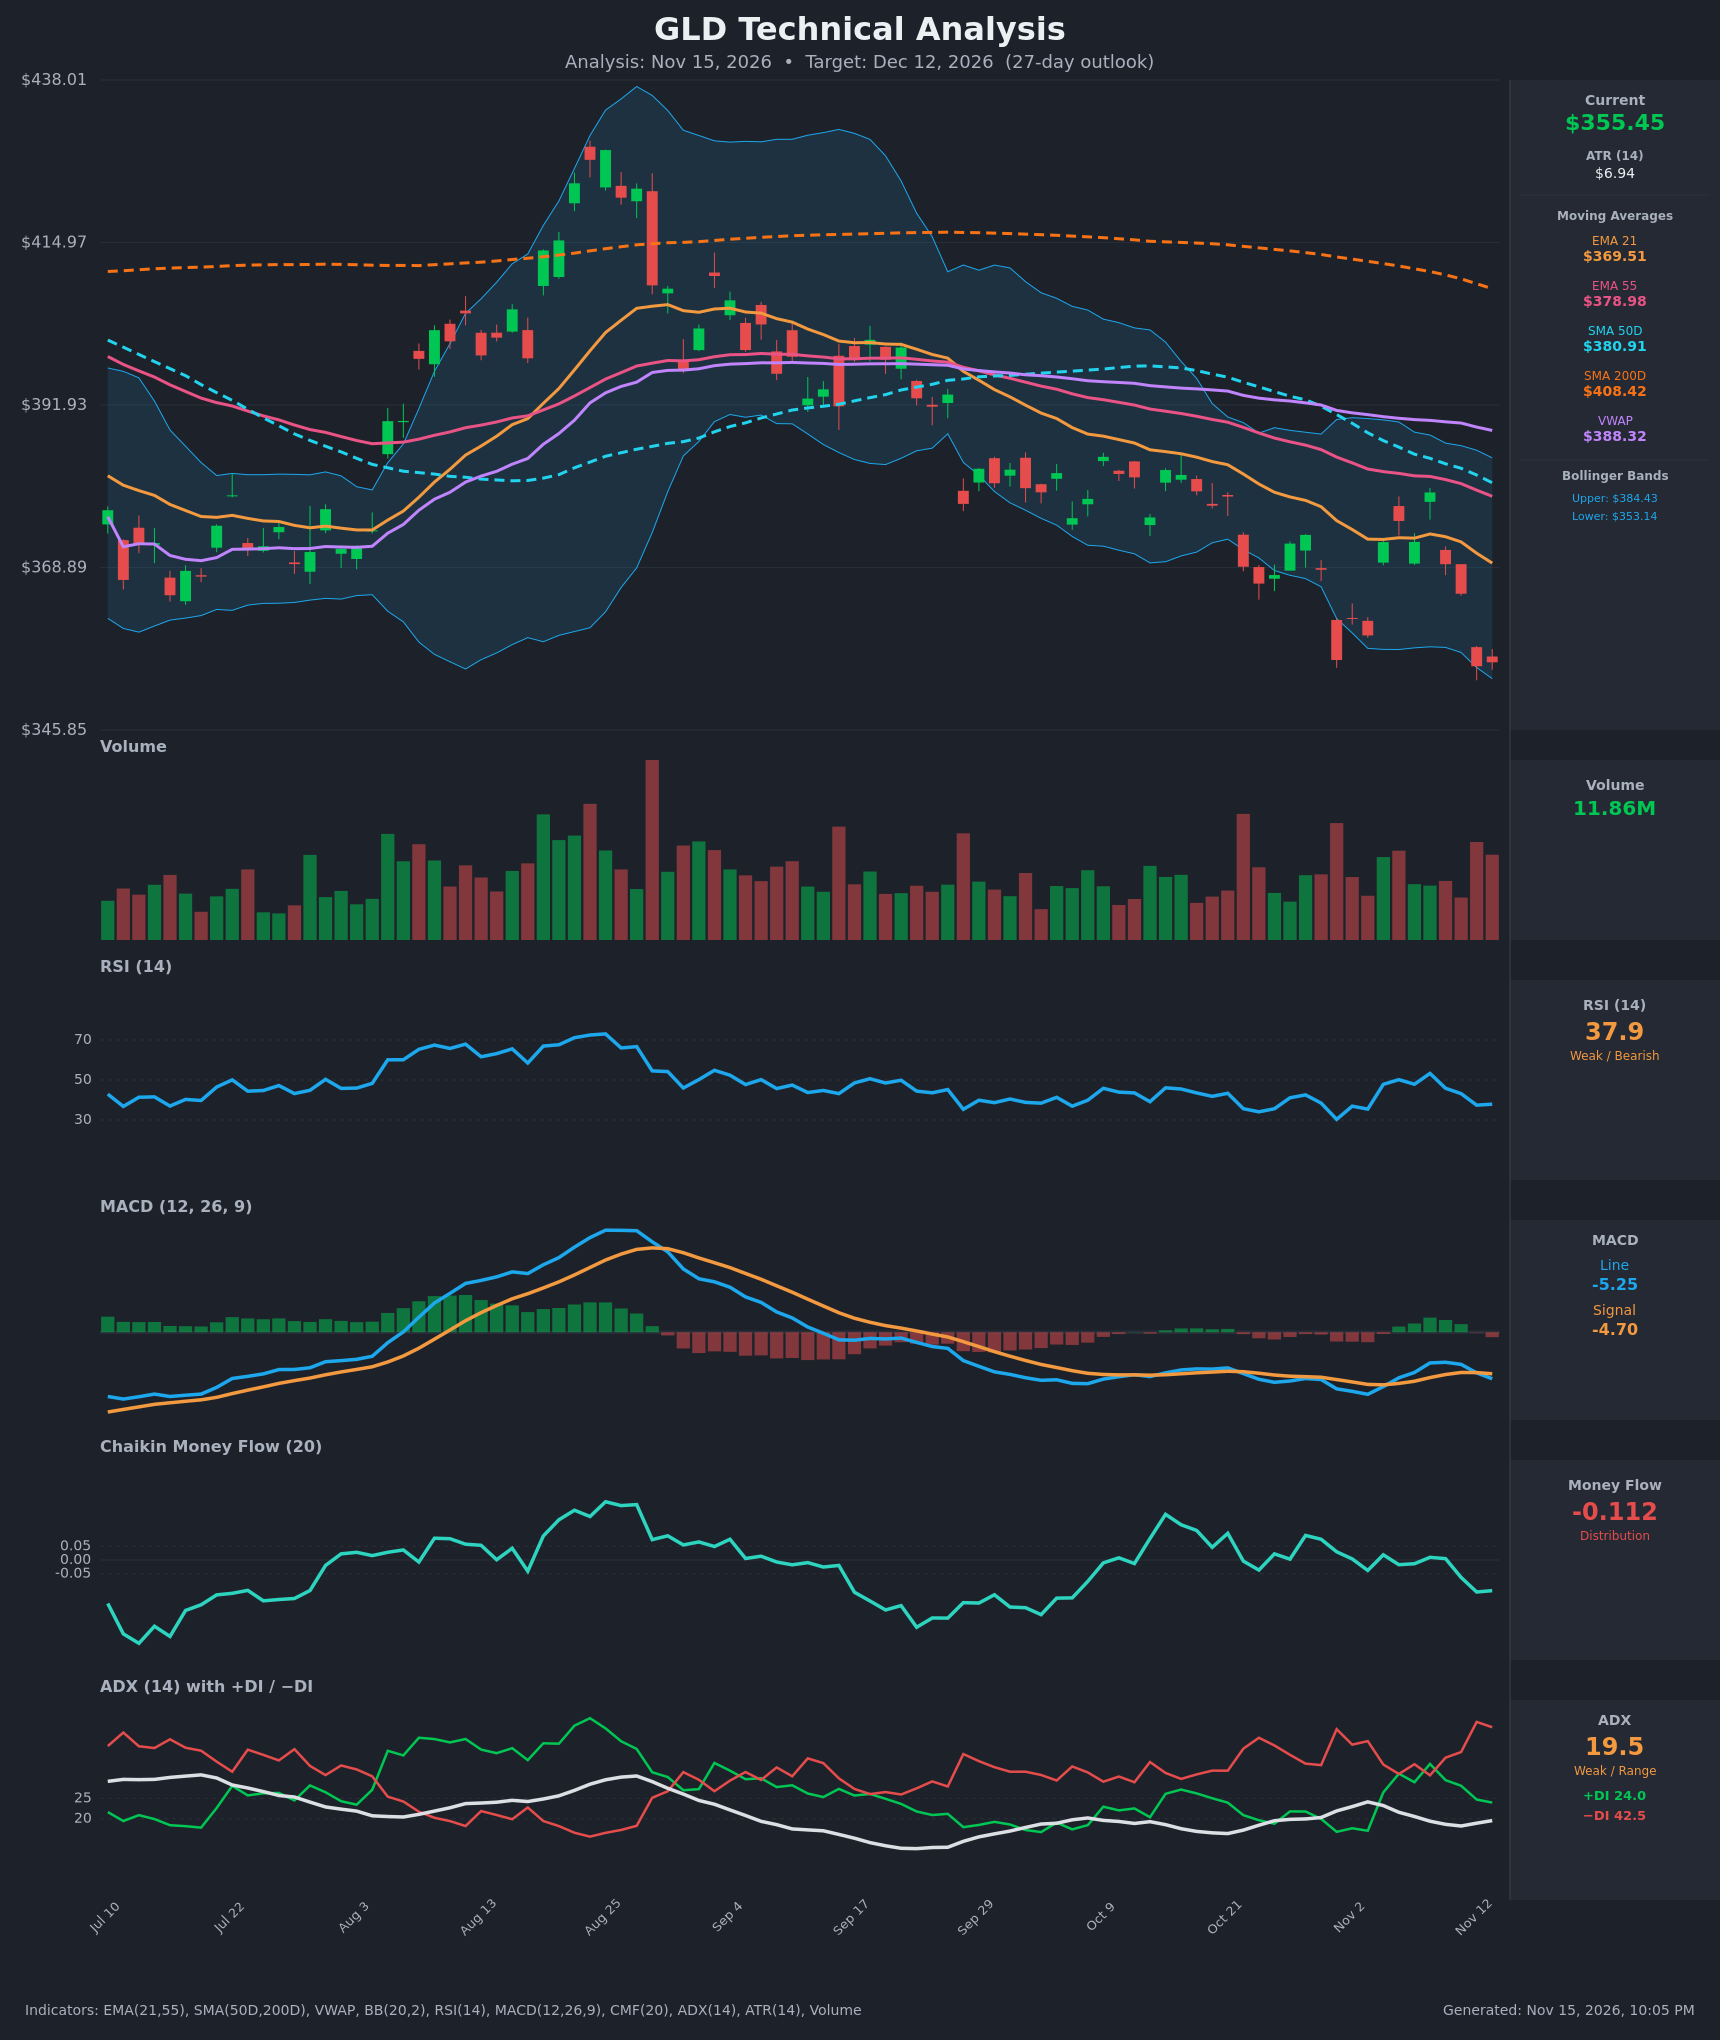
- RSI (14): 37.91, below the 50 midline but not oversold. It bounced to 53 on Nov 9 and has rolled over again. The Oct 30 low of 30.3 is the real oversold mark, and the current reading is a higher low against a roughly equal price low. Momentum is weak and still falling. [Bearish]
- 20 EMA: The 21 EMA is $369.51 and price at $355.45 is about 3.8% below it. It has been falling steadily from $379.56 and is acting as resistance. It rejected the Nov 9 spike to $379.53, and the later rally attempts faded around it. The 21 EMA is below the 55 EMA ($378.98), so the short-term trend is down. [Bearish]
- MACD: The line is -5.25 and the signal is -4.70. The line crossed above the signal around Nov 5 and crossed back below it on Nov 12, a bearish re-cross. Both lines are negative, so the histogram is slightly negative and widening again. The bounce in momentum failed. [Bearish]
- Bollinger Bands (20): The bands run $353.14 to $384.43, and price at $355.45 is hugging the lower band. In a weak-ADX, falling market this is more often "walking the band" than a reversal signal. Bandwidth is moderately wide after the August spike. A close back inside the mid-band (~$368.8) would be needed to turn this constructive. [Bearish]
- CMF (20): -0.112, well below the -0.05 threshold and the lowest reading in the recent window. It has fallen from +0.09 on Oct 28, which shows persistent distribution into the decline. [Distribution]
- ADX (14): 19.5 with −DI 42.5 above +DI 24.0. The ADX is low, so the trend is not strongly established. The DI spread is very wide, though, and −DI is dominant, so the weak ADX reflects a choppy decline rather than an upward bias. The ADX is turning up from 18.2, which suggests the directional move is starting to gain strength. [Weak Trend, Bearish Direction]
- Volume: 11.86M, roughly average. Heavy volume has come on the red candles (the Oct 21 and Nov 12 selloffs), and the green rebounds were on lighter volume. This is mild confirmation of selling pressure, though there is no capitulation spike yet. [Bearish bias, no capitulation]
Other context:
- Price is below the 21 EMA ($369.51), 55 EMA ($378.98), SMA50 ($380.91), VWAP ($388.32) and SMA200 ($408.42).
- The SMA50 is below the SMA200, so the death-cross structure is in place and the long-term trend is down.
DIVERGENCES & TRENDS
- Mild bullish RSI divergence: Price is at or slightly below the Oct 30 low ($355.78), while RSI is 37.9 versus 30.3. This hints at fading downside momentum, but it is not confirmed by MACD or CMF.
- CMF: It is making new lows, which confirms the price decline and argues against the RSI divergence.
- Moving averages: The stack is fully bearish (price < EMA21 < EMA55 < SMA50 < VWAP < SMA200). The averages are still sloping down.
- MACD: The Nov 5 bullish crossover failed within a week and reverted to a bearish cross on Nov 12, a sign of weak rallies.
- DI: −DI has been above +DI almost continuously since late September. The brief +DI lead on Nov 9 was lost within a day.
- Price structure: The decline from the ~$430 August peak has made lower highs and lower lows, falling about 17%.
CHART PATTERNS
- Bearish head and shoulders / topping structure (reversal): The August spike to ~$430 forms the head. The neckline is around $385 to $390, and price broke below it in September. The measured move (head to neckline ≈ $40 to $45) projects toward ~$340 to $345. Price is currently working toward that zone.
- Descending channel with lower highs (continuation): Since mid-September the pattern has been lower highs and lower lows. Failure at the falling 21 EMA supports continuation lower.
- Counter-pattern: The shape could also be read as a bullish falling wedge. That would need a close above $369 to $370, which would also reclaim the 21 EMA, and ADX is too low to confirm it so far.
POTENTIAL SCENARIOS
- Scenario 1: Bearish Continuation to Measured-Move Zone — Sellers stay in control (−DI far above +DI, CMF negative, MACD below signal). Rallies fail near the 21 EMA and price drifts or grinds toward the H&S measured-move area. Trigger: daily close below $350 (recent swing low and lower Bollinger Band). Target: $340 to $345, with extension to ~$330. Invalidation: daily close above $370 (21 EMA reclaim). (50% probability)
- Scenario 2: Bullish Oversold Bounce / Mean Reversion — The RSI higher-low divergence and the lower Bollinger Band support a relief rally toward the mid-band. Trigger: reclaim of $362 to $365 on rising volume with the MACD line crossing back above the signal. Target: $368 to $375, with a stretch to ~$380 (55 EMA / SMA50). Invalidation: break below $350. (35% probability)
- Scenario 3: Neutral Range Consolidation — Price chops between support and the 21 EMA as ADX stays below 20. Trigger: several closes between $350 and $368. Target: $355 to $362. Invalidation: close outside $348 to $370. (15% probability)
PRICE TARGETS
- Target Price: $347.00 (27-day, about -2.4% from current)
- Expected Range: $326.00 to $376.00 (width $50, about 14.1% of current price, in line with the 12-18% guidance for a 27-day horizon)
- Key Levels: Support at $345.00, Resistance at $369.50
The range is centered slightly below the current price to reflect the downtrend bias. At about 3.7 ATRs per side over 27 days, it is consistent with the stock's volatility.
OVERALL BIAS
OVERALL BIAS: BEARISH - Price sits below every major moving average, −DI dominates +DI, CMF shows distribution, and the MACD re-crossed bearish after a failed rally. A mild RSI divergence and a lower-band reading raise the risk of a bounce, so conviction is modest.
This is educational analysis and not financial advice.