GLD 62-day bearish forecast — Nov 15, 2026
- Bias: Bearish
- Timeframe: 62 days (made Nov 15, 2026, target date Jan 15, 2027)
- Price at analysis: $355.45
- Price target: $349.00
- Expected range: $322.00 – $389.00
- Result: Pending — graded after the close on Jan 15, 2027
Get a free AI analysis of GLD today
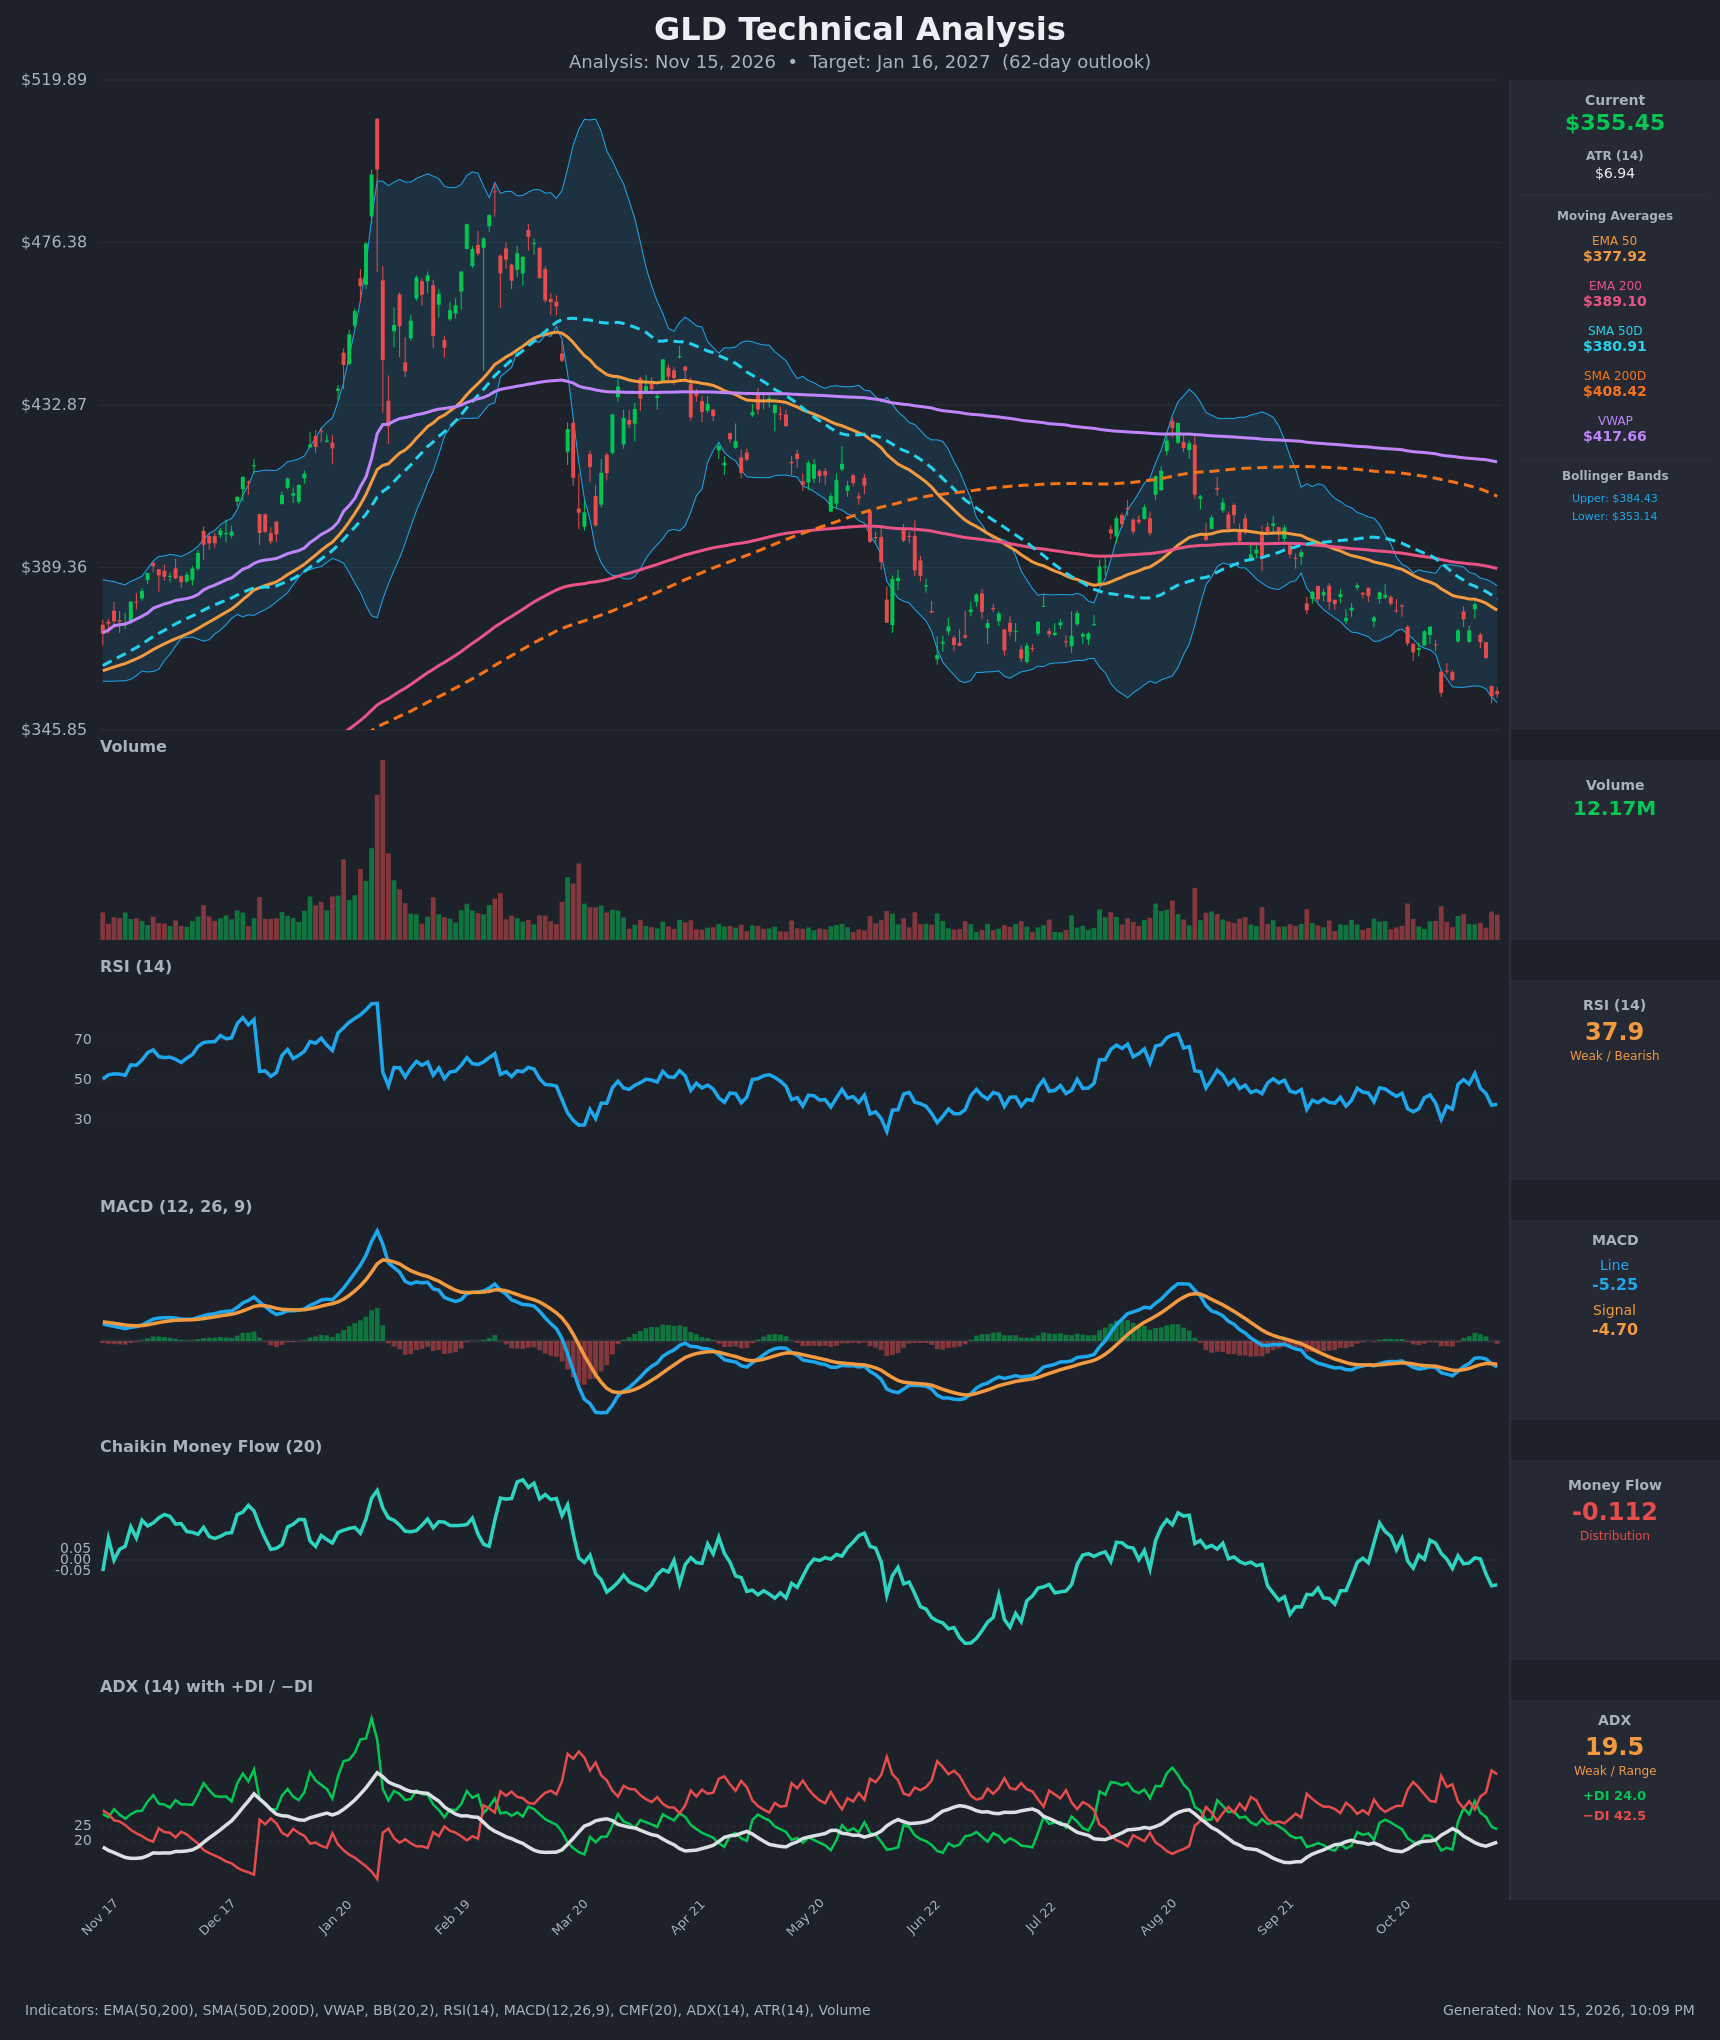
Analysis
TECHNICAL INDICATORS
- RSI (14): 37.9, below 50 and approaching oversold but not there. It has been capped in the 30-50 range for months and rolled over from ~53 on Nov 9. Momentum is weak with no bullish divergence yet. [Bearish]
- 20 EMA: The 20 EMA isn't given directly. Price ($355.45) sits below EMA50 ($377.92), which tracks the middle Bollinger Band area around $368.8, so price is well under short-term averages. These act as overhead resistance. [Bearish]
- MACD: Line -5.25 is below Signal -4.70, and the histogram is negative. A bearish re-cross occurred on Nov 12-13 after the line had briefly been above the signal's rally. Both lines are below zero. [Bearish]
- Bollinger Bands (20): Upper $384.43, lower $353.14, so price at $355.45 is hugging the lower band (~7% of band width from the lower edge). That shows a persistent downtrend with a walk along the band. It is also stretched short term, so a bounce toward the mid-band (~$368.8) is possible. [Bearish]
- CMF (20): -0.112, below -0.05 and falling from slightly positive earlier in the month. Selling pressure is increasing. [Distribution]
- ADX (14): 19.5 with -DI (42.5) well above +DI (24.0). The trend is weak by ADX level, but directional pressure is clearly bearish and the -DI spread is widening. [Weak Trend + Bearish direction]
- Volume: 12.17M, near average with no capitulation spike. The recent selloff has not been accompanied by climactic volume, so there is no sign of a washout bottom. The big volume spike was at the Jan peak. [Neutral to mildly Bearish]
Other trend context:
- Price is below EMA50 ($377.92), EMA200 ($389.10), SMA50D ($380.91), SMA200D ($408.42) and VWAP ($417.66). That is a fully bearish stack.
- SMA50D ($380.91) has already crossed below EMA/SMA200 structure, with SMA50D under SMA200D. This is a death-cross regime. The 50 EMA is under the 200 EMA as well.
DIVERGENCES & TRENDS
- No clear bullish RSI divergence. Price is at new lows around $355, and RSI at 37.9 is above its prior lows (~30 on Oct 30), so there is a mild positive spread, but it is not a confirmed divergence.
- MACD is moving back down after a brief improvement, with a bearish cross on Nov 12 and widening gap.
- All the moving averages are sloping down and stacked above price (EMA50 < EMA200 < SMA200D < VWAP). This reflects a persistent downtrend since the Jan peak (~$519).
- DI lines: -DI re-took control by a wide margin on Nov 12 after +DI briefly led on Nov 4-9, a failed bullish attempt.
- CMF turned from neutral to distribution (-0.117 at the low), confirming selling.
- The price has made a series of lower highs (~$433 in Aug, ~$379 Nov 9) and lower lows (~$355).
CHART PATTERNS
- Bearish Rising Wedge / failed rally followed by lower highs: After the Jan peak at ~$519 and a Mar-Apr drop, the price made a lower-high structure. The Aug rally to ~$430 failed beneath SMA200D and VWAP. The more recent action is a descending channel of lower highs and lower lows.
- Possible Bearish Descending Triangle / support break: The area around $353-$365 has been tested several times (Jun, Jul, Oct, Nov). A decisive break below ~$353 would open a measured move lower toward $335-$340. The pattern is not confirmed until a breakdown with a close.
- Potential Bullish Triple Bottom or Double Bottom: Lows near $365 in Jun and ~$355 in Oct-Nov suggest a possible base, but without a break above ~$380 this is only speculative.
- Targets: breakdown target roughly $335-$340 (pattern height ~$15-$25 below $355), and relief bounce target ~$369-$380 (mid-band and EMA50).
POTENTIAL SCENARIOS
- Scenario 1: Bearish Support Breakdown and Continuation — Price breaks the $353 lower-band/support zone and slides under bearish MA stack, with -DI dominance and negative CMF. Trigger: daily close below $352 on rising volume. Target: $335-$340. Invalidation: close above $370 (mid-band) with MACD re-cross. (50% probability)
- Scenario 2: Neutral Choppy Base Between $345 and $375 — Price oscillates around support with RSI below 40, then recovers into the mid-band, but fails at the EMA50. Trigger: hold of $350 with RSI bouncing to 45-50. Target: $350-$370 range. Invalidation: close below $345 or above $380. (22% probability)
- Scenario 3: Bullish Oversold Reversal — Price at the lower Bollinger Band triggers mean reversion and a rally toward the declining EMA50/SMA50D. Trigger: close above $370 with +DI crossing above -DI. Target: $380-$388. Invalidation: loss of $350. (28% probability)
PRICE TARGETS
For a 62-day horizon (30-60 day guidance of 12-18% rising to 61-180 day guidance of ~18-30%), I use an ~19% range width.
- Target Price: $349.00 (62-day target, modestly below current price, reflecting a bearish bias with a likely oscillation after a bounce)
- Expected Range: $322.00 to $389.00 (width $67 = ~18.8% of current price)
- Key Levels: Support at $345.85, Resistance at $368.80
OVERALL BIAS
OVERALL BIAS: BEARISH - Price sits below every major moving average and VWAP, with a bearish MACD cross, CMF in distribution, and -DI (42.5) far above +DI (24.0). Lower highs and lower lows remain intact, though the proximity to the lower Bollinger Band and RSI near 38 argue for a bounce before further downside.
This is educational analysis and not financial advice.