QUBT 4-day bearish forecast — Oct 31, 2026
- Bias: Bearish
- Timeframe: 4 days (made Oct 31, 2026, target date Nov 3, 2026)
- Price at analysis: $6.60
- Price target: $6.50
- Expected range: $6.36 – $6.74
- Result: Correct (-2.9%) — closed at $6.41 on Nov 3, 2026; quality score 100/100
Get a free AI analysis of QUBT today
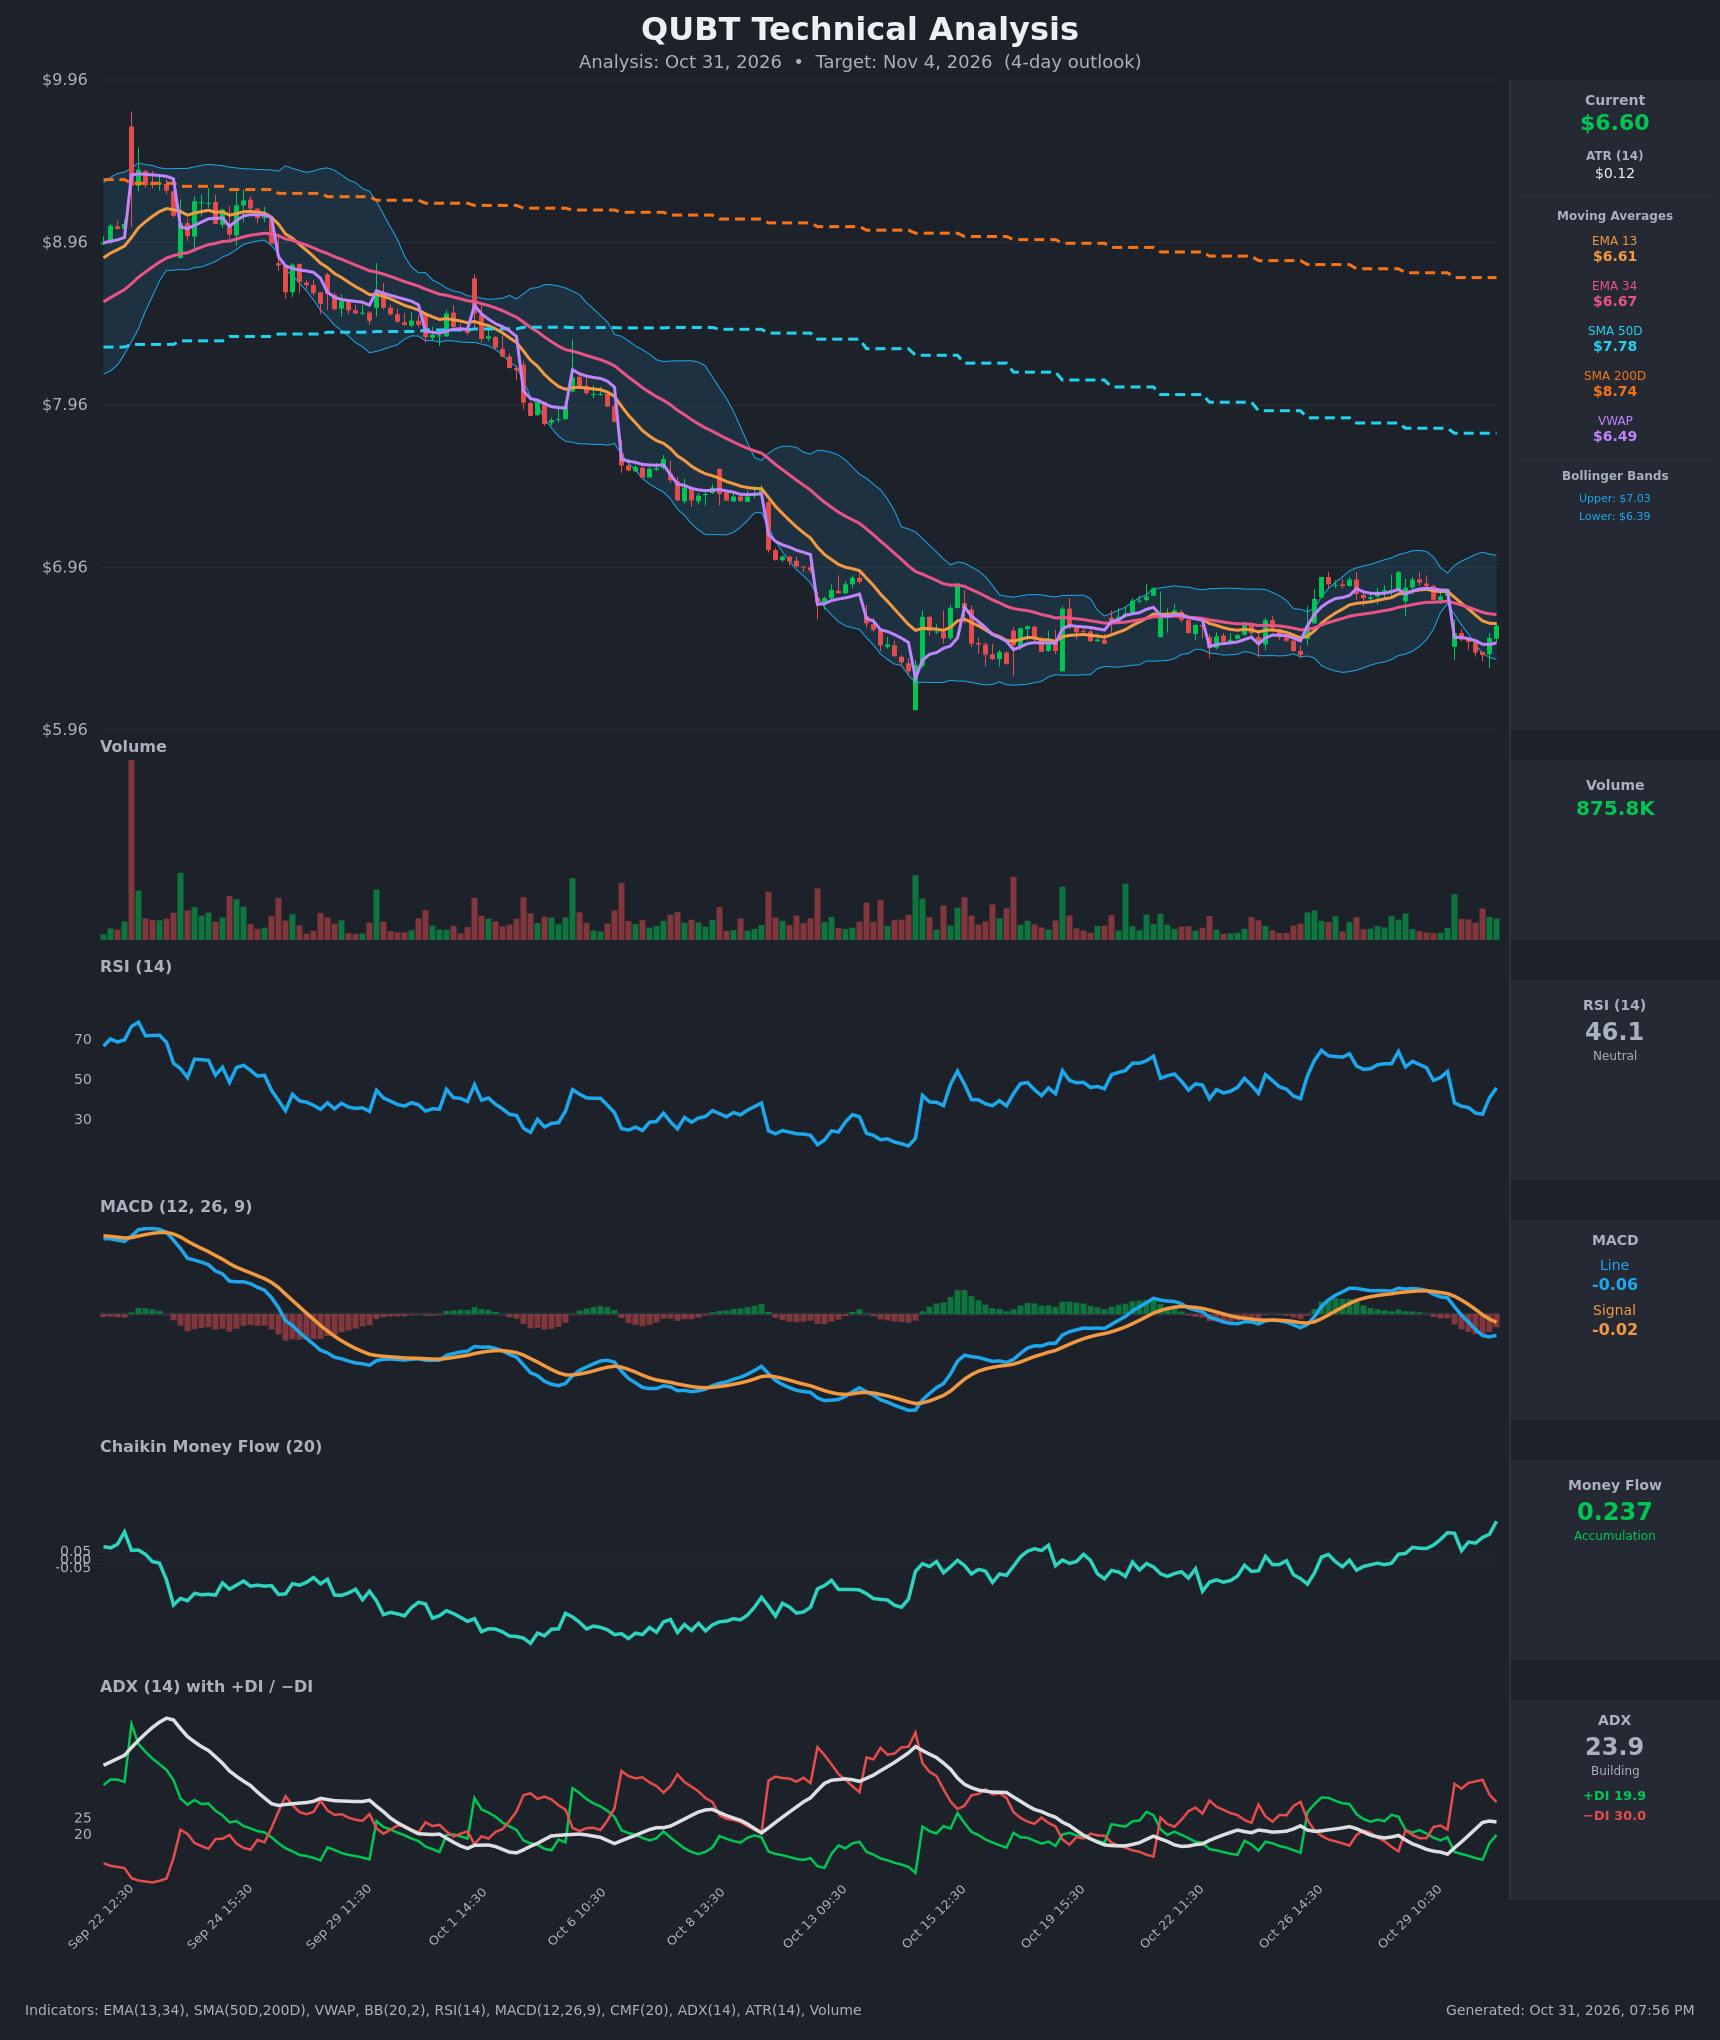
Analysis
TECHNICAL INDICATORS
- RSI (14): 46.12, up from a 32.9 low on Oct 30 13:30 but still below 50. Momentum is recovering from near-oversold without confirming a trend change. [Neutral]
- 20 EMA: The data gives EMA 13 at $6.61 and EMA 34 at $6.67, and the 13 crossed below the 34 on Oct 30. Price at $6.60 sits just under both, so they act as overhead resistance. [Bearish]
- MACD: Line -0.056 is below signal -0.022, after a bearish cross on Oct 30 (around 10:30). Both are below zero and the histogram is negative. The line has flattened since its -0.060 low, so downside momentum is easing. [Bearish]
- Bollinger Bands (20): Upper $7.03, lower $6.39, so price at $6.60 is in the lower-middle of the band (about 33% of the way up). Bandwidth is moderate and contained, which fits the two-week range. A bounce from the lower band has begun but is not complete. [Neutral]
- CMF (20): 0.237 and rising, well above the +0.05 threshold. Buying pressure was strong into the close and is clearly diverging from price. [Accumulation]
- ADX (14): 23.9, rising from 14 but still just under the 25 trend threshold. −DI (30.0) is well above +DI (19.9), so sellers still control direction, though −DI has been fading from 36.9. [Moderate Trend, Bearish direction]
- Volume: 875.8K, an average-to-slightly-elevated bar. The recent green bars on the bounce show modest buying, but there is no volume surge to confirm a reversal. [Neutral to mildly supportive of bounce]
DIVERGENCES & TRENDS
- Bullish divergence in CMF: CMF has climbed to its highest level in the sample (0.237) while price made a lower low and remains below the EMAs. This suggests dip-buying and accumulation.
- RSI: It fell from 54 to 33 on the gap-down and is hooking back up toward 50, where the EMAs sit.
- Crossovers: The EMA13/EMA34 bearish cross and the MACD bearish cross both happened on Oct 30. The −DI/+DI spread widened sharply on the gap down.
- Long-term trend: Price is far below the SMA50D ($7.78) and SMA200D ($8.74). The SMA50 is already below the SMA200, a death-cross structure, so the major trend is down.
- VWAP: Price is above VWAP ($6.49), a short-term positive. The Oct 30 gap down from $6.83 to $6.55 has not been filled.
CHART PATTERNS
- Rectangle/consolidation base after a long downtrend: Price has ranged roughly $6.30–$6.95 since mid-October following the slide from $9+. After a prior downtrend this leans toward a continuation pattern (closest to a bearish pennant or descending-triangle setup in the reference), though it has not broken down.
- Overhead supply: Lower highs and the unfilled gap at $6.83 cap rallies. A break below the $6.39–$6.30 zone would project a measured move toward $6.0, near the October low.
- Bullish counter-case: If the base holds and price reclaims $6.67–$6.83, the range is more likely a bottoming structure. That is not confirmed yet.
POTENTIAL SCENARIOS
- Scenario 1: Bearish Rejection at EMAs — Price fails at the EMA13/34 zone, with −DI dominance and a negative MACD pulling it back toward the lower band. Trigger: rejection at $6.61–$6.67, then a loss of $6.50. Target: $6.40–$6.45. Invalidation: a close above $6.75. (45% probability)
- Scenario 2: Bullish Accumulation Bounce — CMF accumulation and the RSI recovery lead to a push through the EMAs and a partial gap fill. Trigger: a close above $6.67 on rising volume. Target: $6.80–$6.85. Invalidation: a drop below $6.45. (35% probability)
- Scenario 3: Neutral Chop — Price oscillates between the lower band and the EMAs. Trigger: a failure to break either $6.67 or $6.40. Target: $6.55–$6.65. Invalidation: a break outside $6.39–$6.75. (20% probability)
PRICE TARGETS
For a 4-day horizon, the range width is about $0.38, or 5.8% of the current price, which fits the 4–8% guidance.
- Target Price: $6.50 (4 days)
- Expected Range: $6.36 to $6.74
- Key Levels: Support at $6.39, Resistance at $6.67
OVERALL BIAS
OVERALL BIAS: BEARISH - Price is below the declining EMAs, the SMA50 and the SMA200, with −DI well above +DI and a negative MACD, and the Oct 30 gap down is unfilled. The strong CMF is a real offset, so conviction is modest and a bounce toward $6.80 remains plausible.
This is educational analysis and not financial advice.