QUBT 27-day bearish forecast — Nov 15, 2026
- Bias: Bearish
- Timeframe: 27 days (made Nov 15, 2026, target date Dec 11, 2026)
- Price at analysis: $5.56
- Price target: $5.15
- Expected range: $4.40 – $6.25
- Result: Pending — graded after the close on Dec 11, 2026
Get a free AI analysis of QUBT today
Analysis
TECHNICAL INDICATORS
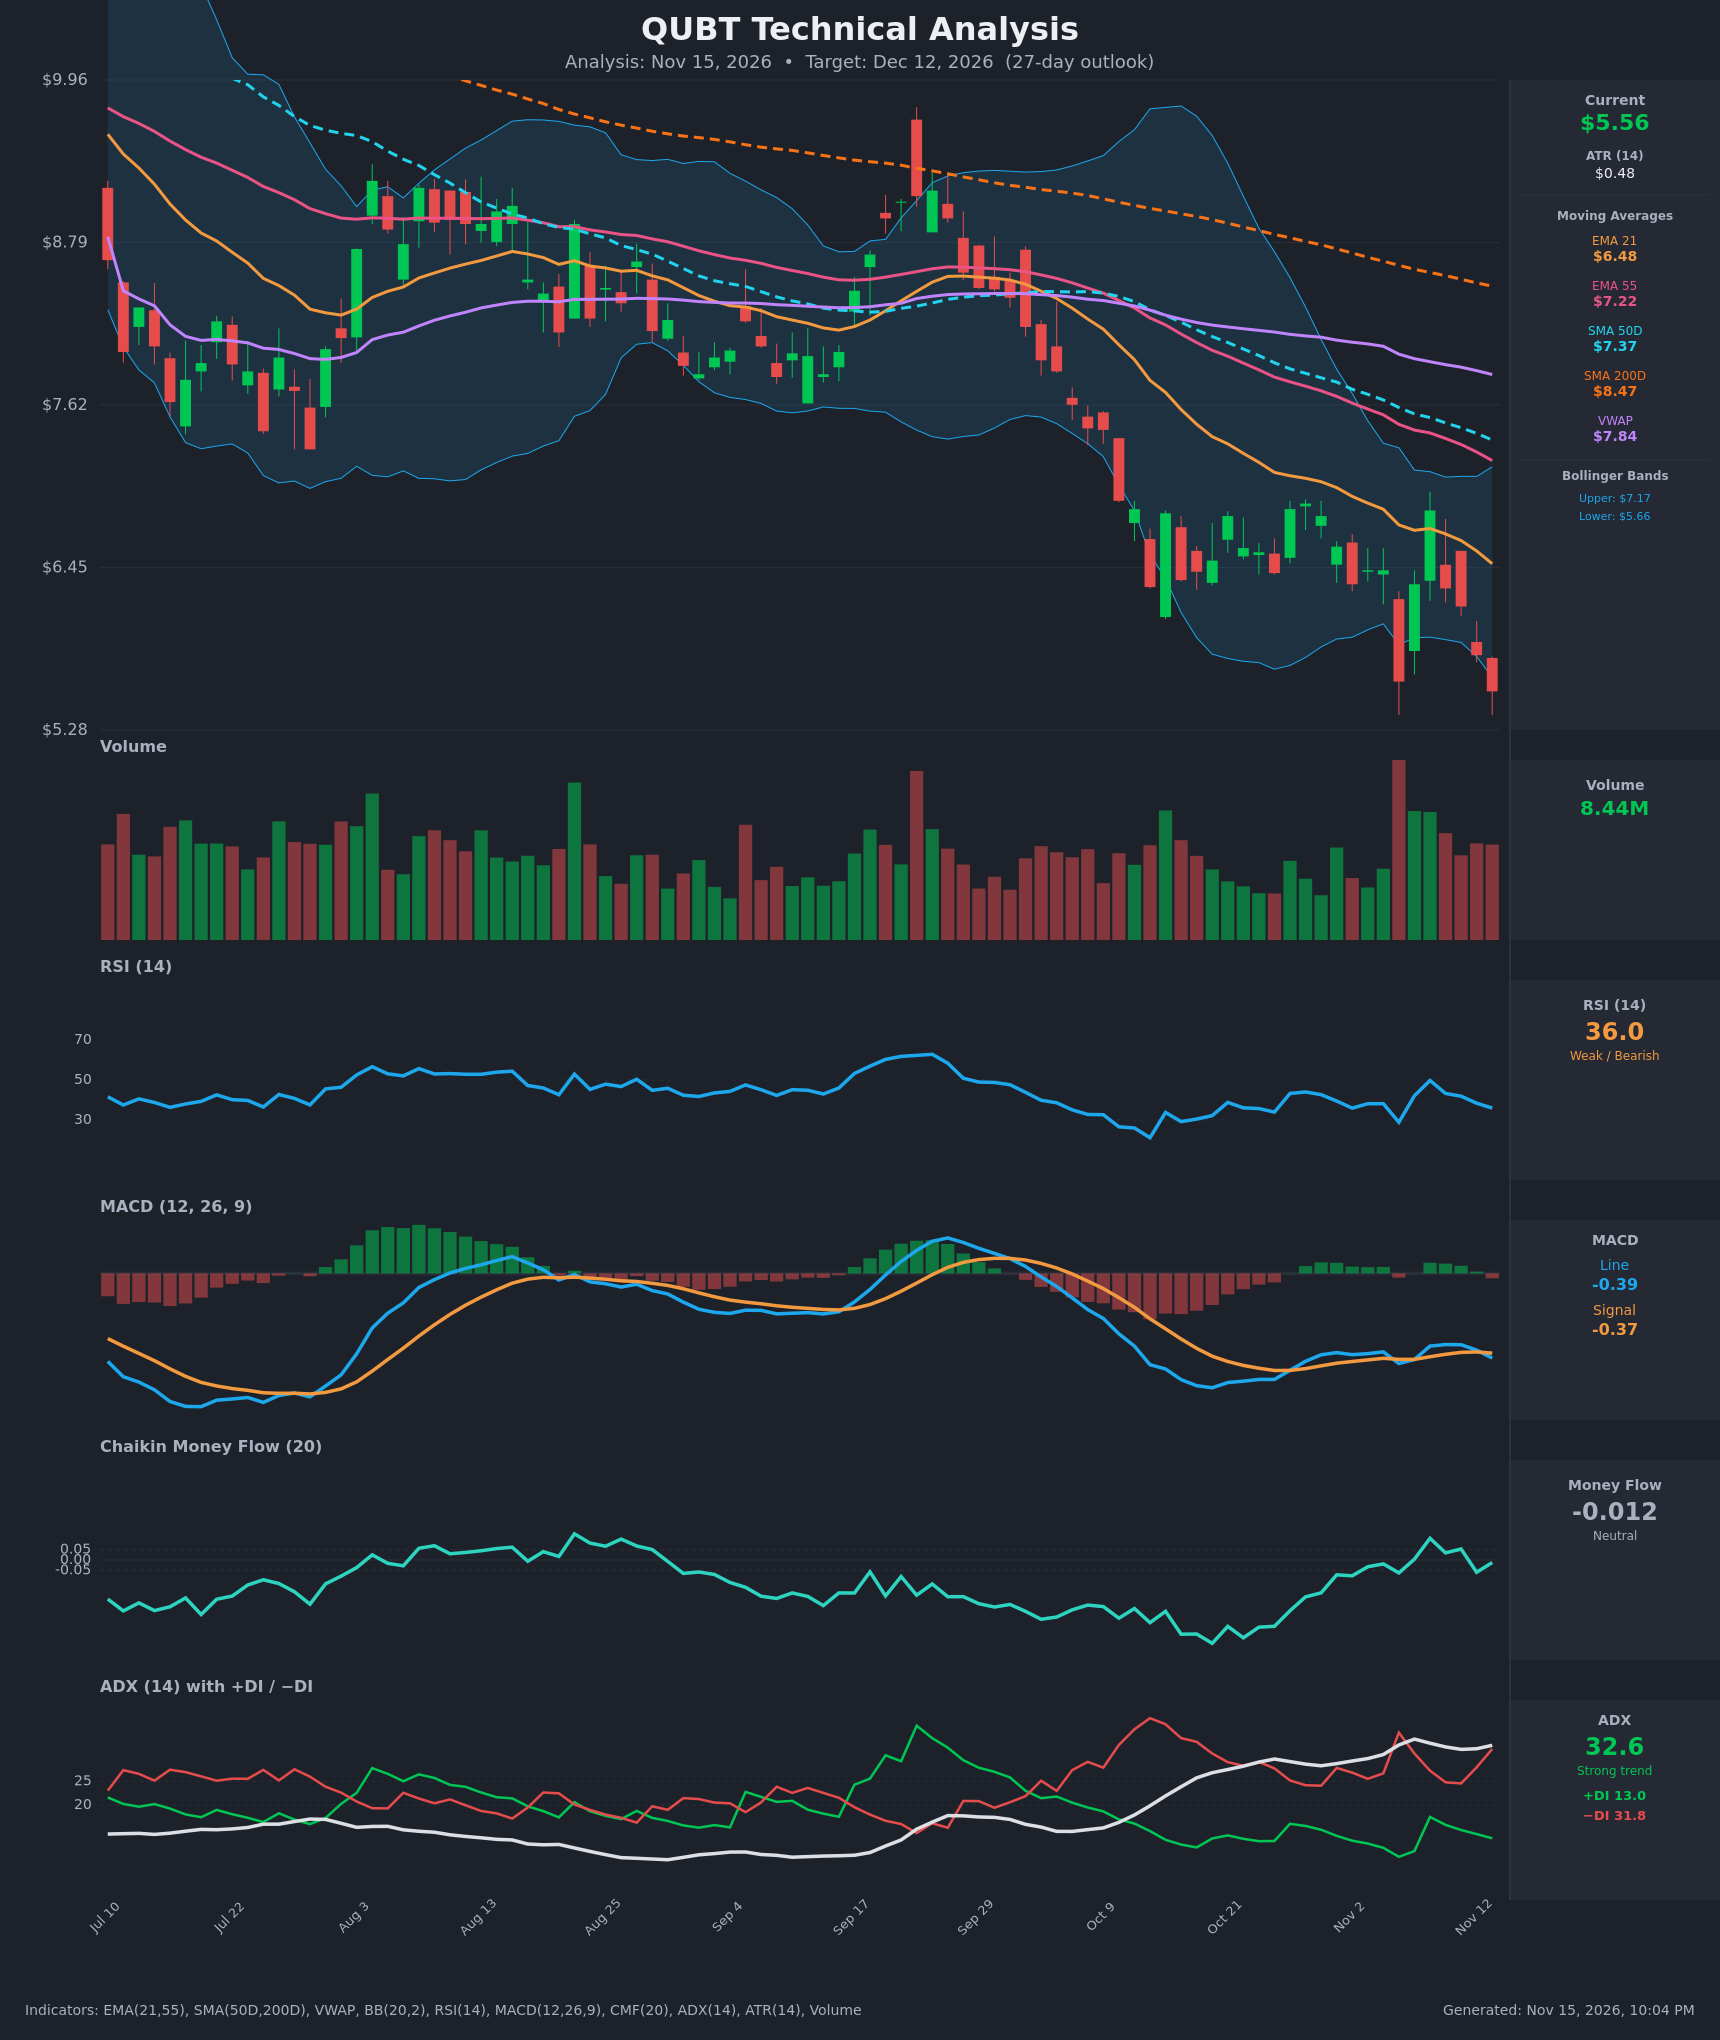
- RSI (14): 35.97, down from 49.8 on Nov 9 and sitting just above oversold (30). It made a lower low at 28.9 on Nov 5, and the bounce faded quickly. Momentum is weak and still pointing down. [Bearish]
- 20 EMA: The EMA 21 is $6.48 and falling, with price at $5.56, about 14% below it. EMA 21 is below EMA 55 ($7.22), which is below SMA50D ($7.37) and SMA200D ($8.47). The stack is fully bearish and every average is overhead resistance. [Bearish]
- MACD: The line (-0.389) is below the signal (-0.367) after a fresh bearish crossover on Nov 13. The histogram has turned slightly negative. Both lines are below zero, so momentum is bearish, though the readings are shallow. [Bearish]
- Bollinger Bands (20): Bands run $5.66 to $7.17. Price at $5.56 is below the lower band, a downside breakout. This shows strong selling pressure and an extended, stretched condition. A band-walk is possible in a strong trend, but a snap-back toward the mid-band (~$6.42) is also likely. [Bearish]
- CMF (20): -0.012 is neutral, between ±0.05. It has improved from -0.32 in late October, so selling pressure has eased even as price made new lows. It slipped from +0.05 and +0.10 earlier in the month. [Neutral]
- ADX (14): 32.6 and rising from about 28, so the trend is strong. −DI at 31.8 is far above +DI at 13.0, so bears are firmly in control. [Strong Trend – Bearish]
- Volume: 8.44M is roughly average, with no capitulation spike on the latest decline. A big-volume red bar appeared in early November (the Nov 5 flush), and since then the bounces have not held. Volume is not confirming a bottom. [Neutral-to-Bearish: no capitulation yet]
DIVERGENCES & TRENDS
- Divergence: There is a mild bullish divergence in CMF. It is flat around zero while price made new lows, so distribution has faded. RSI shows no clear bullish divergence, since 36 sits above the Nov 5 low of 28.9 while price is now at or below that low ($5.56 vs $5.63). That is a slight bullish RSI divergence, but it is unconfirmed.
- Trend: The price is in a steady downtrend from $9+ in September. It carries a death-cross structure (SMA50D below SMA200D) and a bearish EMA21/EMA55 cross. Price is well below VWAP ($7.84) and SMA200D.
- Crossovers: MACD crossed bearish on Nov 13. −DI is dominant and ADX is rising. Price broke below the lower Bollinger Band.
- Risk: The price is stretched, about 14% below EMA21. Mean-reversion bounces toward $6.0–6.4 are likely along the way, as seen on Nov 6 and Nov 9.
CHART PATTERNS
- The decline resembles a Bearish Flag / descending channel with lower highs and lower lows. Bounces to $6.86 and $6.91 were each rejected, and price has broken to new lows near $5.56.
- Price lost the $5.63 swing low from Nov 5, which is a range breakdown with a measured-move bias lower. The flag-style measured move implies roughly $5.00–$5.20.
- The previous consolidation (about $6.20–$6.90) broke down on Nov 12–13, which is bearish continuation.
- There is no reliable reversal pattern yet. A double bottom would need a retest of about $5.60 and a rally above about $6.30.
POTENTIAL SCENARIOS
- Scenario 1: Bearish Trend Continuation — Downtrend continues with a strong ADX, −DI dominance, and all averages overhead. Price grinds lower with only weak bounces. Trigger: daily close below $5.50 and failure to reclaim the lower band ($5.66). Target: $4.80–$5.10. Invalidation: daily close above $6.20 (EMA21 area). (50% probability)
- Scenario 2: Bullish Oversold Bounce / Mean Reversion — Price is below the lower band with a neutral CMF and RSI near 36. It snaps back toward the mid-band and EMA21 but stays in the downtrend. Trigger: reclaim of $5.90 on rising volume. Target: $6.40–$6.60. Invalidation: new low below $5.28. (30% probability)
- Scenario 3: Neutral Basing Range — Price chops around the lows between $5.20 and $6.20 as selling exhausts. Trigger: failed breakdown with CMF holding near zero. Target: $5.50–$5.90. Invalidation: close above $6.30 or below $5.20. (20% probability)
PRICE TARGETS
- Target Price: $5.15 (27-day target)
- Expected Range: $4.40 to $6.25 (width $1.85 = ~33% of current price; for a 27-day horizon on a volatile stock with ATR ~8.7% of price, this is wider than the generic 12–18% guide, and the width reflects ATR-based volatility)
- Key Levels: Support at $5.28 (chart low), Resistance at $6.48 (EMA 21)
OVERALL BIAS
OVERALL BIAS: BEARISH - The stock is in a strong downtrend (ADX 32.6, −DI 31.8 vs +DI 13.0), trades below all moving averages and the lower Bollinger Band, and has a fresh bearish MACD crossover. A neutral CMF and an oversold bounce are the main risks, so expect rallies toward $6.00–$6.50 to be sold.
This is educational analysis and not financial advice.