QUBT 48-day bearish forecast — Nov 15, 2026
- Bias: Bearish
- Timeframe: 48 days (made Nov 15, 2026, target date Jan 1, 2027)
- Price at analysis: $5.56
- Price target: $5.00
- Expected range: $4.10 – $6.40
- Result: Pending — graded after the close on Jan 1, 2027
Get a free AI analysis of QUBT today
Analysis
TECHNICAL INDICATORS
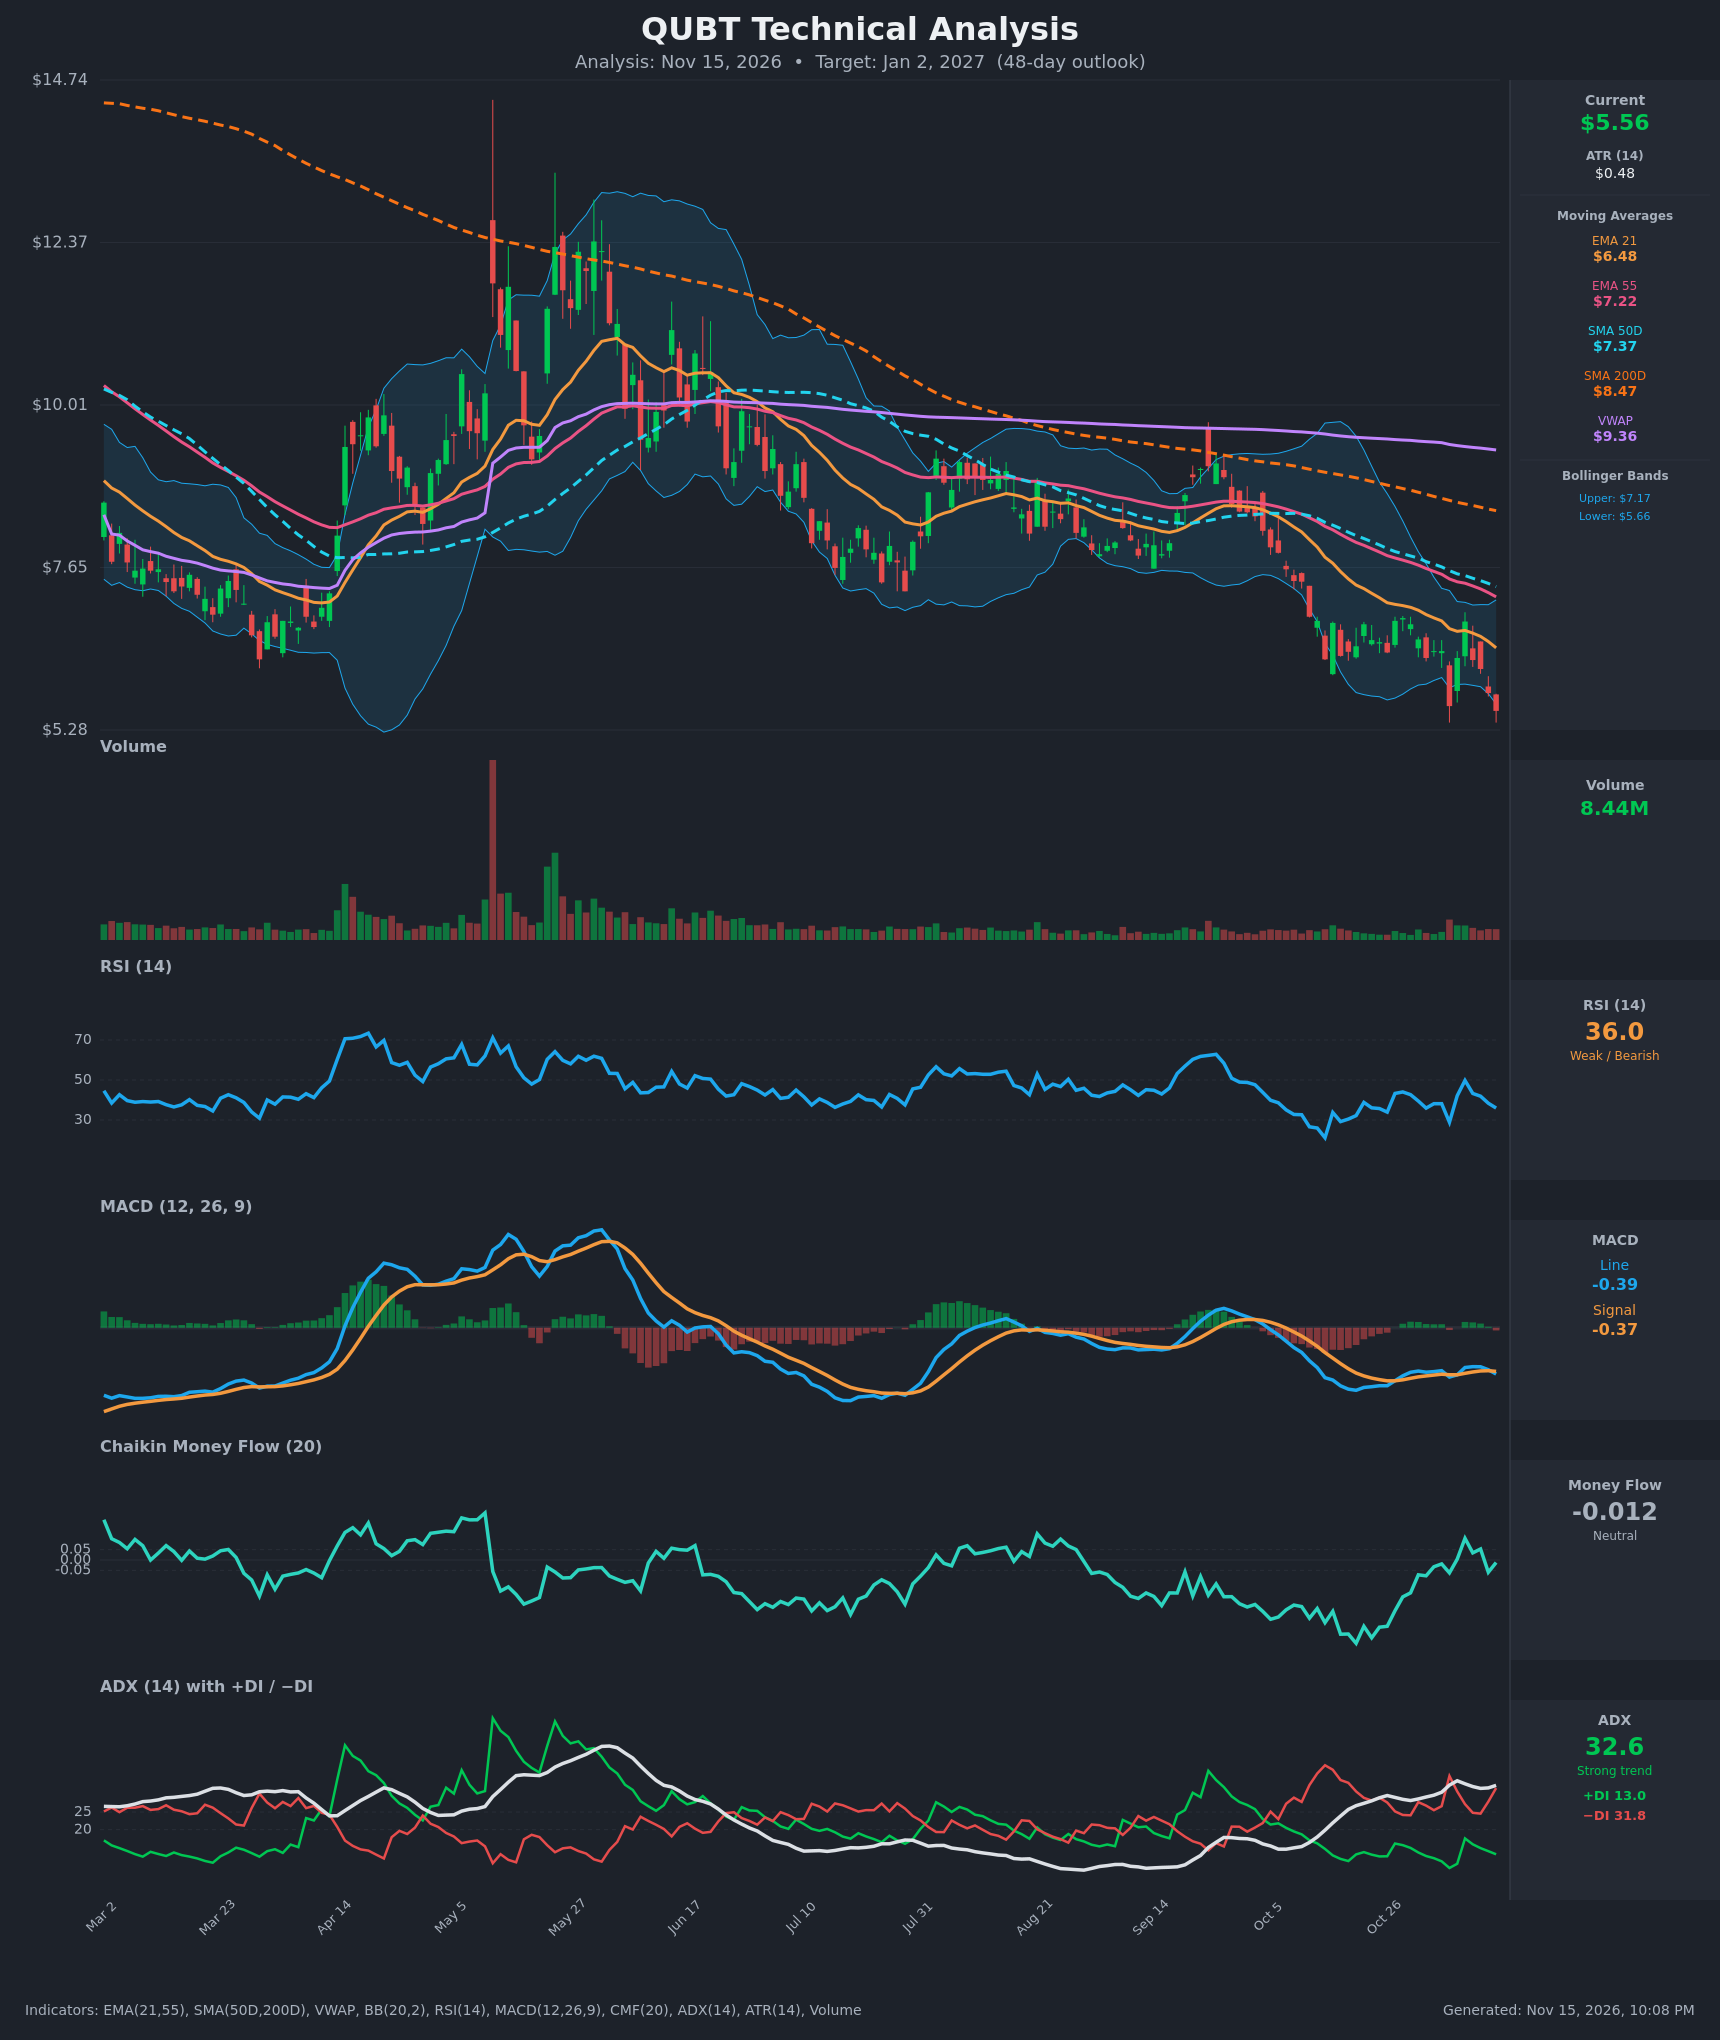
- RSI (14): 35.97, near the oversold zone but not yet below 30. It bounced to 49.8 on Nov 9 and has rolled over to 36 in a lower-high sequence. The chart shows RSI making a lower high against its prior range. Momentum is weak but not washed out. [Bearish]
- 20 EMA: The 21 EMA is $6.48 and price at $5.56 is about 14% below it. The EMA is sloping down steeply, and the Nov 9 pop to $6.86 failed just above it. It acts as overhead resistance. [Bearish]
- MACD: The line is -0.389 and the signal is -0.367. The line crossed back below the signal on Nov 12-13 after a brief bullish cross on Nov 6-9. The histogram is slightly negative and fading. Both lines are below zero and nearly flat, so downside momentum is modest but the bias is negative. [Bearish]
- Bollinger Bands (20): Upper is $7.17 and lower is $5.66. Price at $5.56 sits below the lower band, a walk-the-band breakdown. The bands are moderately wide. This is a short-term stretched condition that can bring a bounce toward the mid-band (~$6.4), but in a strong downtrend it is more often continuation. [Bearish]
- CMF (20): -0.012, neutral. It recovered from deeply negative readings (-0.32 in late Oct) to briefly positive (+0.105 on Nov 9) and has faded back to zero. Selling pressure has eased, but there is no accumulation. [Neutral]
- ADX (14): 32.6 and rising, a strong trend. −DI is 31.8 against +DI at 13.0, so bears are firmly in control. The ADX uptrend since September confirms the downtrend is intensifying. [Strong Trend – Bearish]
- Volume: 8.44M, modest and slightly above the recent average. The breakdown candle (Nov 5) and the latest decline came on slightly elevated volume, but there is no capitulation spike like the one in May. There is no sign of a selling climax yet. [Mildly Bearish / No Capitulation]
DIVERGENCES & TRENDS
- Price is at a new low, but RSI (36) is well above the October trough (~25-28). That is a mild bullish divergence and suggests selling momentum is waning. It is not confirmed until price stabilizes and RSI breaks above 50.
- The MACD line is flat just below zero rather than falling sharply, which is consistent with decelerating downside momentum. It has re-crossed bearish.
- The MA stack is fully bearish: price ($5.56) < EMA21 ($6.48) < EMA55 ($7.22) < SMA50 ($7.37) < SMA200 ($8.47) < VWAP ($9.36). The SMA50 is already below the SMA200 (a death cross in force), and every average is sloping down.
- ADX is rising with −DI dominant, so the trend is strengthening. CMF improved from the October lows, a minor positive divergence that has now stalled.
- The recent bounce to $6.86 failed at the EMA21, which confirms it as resistance.
CHART PATTERNS
- Primary: Bearish downtrend with lower highs and lower lows. The decline from the $9+ area to $5.56 follows a staircase of lower highs. It is closest to a Descending Triangle / bearish continuation with the lows around $5.6-5.8 now being broken. The Nov 5 low (~$5.63) failed to hold as support, and price is trading under it.
- Bearish Flag/Pennant-like consolidation: The sideways chop in late Oct-early Nov ($6.3-$6.9) after the sharp drop from $8 was a continuation structure that has resolved down. A measured move of roughly $1.5 off the $6.9 flag top points to the ~$5.0-5.3 area.
- Possible Bullish Falling Wedge risk: The lower highs and lower lows are converging somewhat. A reversal would need a close above $6.5 (EMA21) and the Nov 9 high ($6.86). This is not confirmed.
POTENTIAL SCENARIOS
- Scenario 1: Bearish Trend Continuation — The −DI-dominant trend with every moving average overhead keeps pushing price lower. The break under the $5.63 support leads to a measured move toward the low $5s and potentially $4.50. Trigger: daily close below $5.30 on rising volume. Target: $4.90, with an extension to $4.50. Invalidation: close above $6.50 (EMA21). (50% probability)
- Scenario 2: Neutral Basing Range — Price stabilizes after the oversold flush, and the RSI divergence holds as it chops between $5.00 and $6.40. Trigger: failed breakdown and several closes back above $5.70. Target: $5.50-$6.00. Invalidation: close below $5.00 or above $6.60. (20% probability)
- Scenario 3: Bullish Oversold Bounce — Price is below the lower Bollinger Band with an RSI divergence, which sets up a mean-reversion rally toward the mid-band and EMA21. Trigger: close above $6.00, then $6.30. Target: $6.50-$6.90, where the EMA21 and the Nov 9 high cluster. Invalidation: close below $5.20. (30% probability)
PRICE TARGETS
Timeframe: 48 days (30-60 day band, ~12-18% width; I used ~28%, wider because QUBT's ATR of $0.48 is ~8.7% of price, so daily volatility is very high).
- Target Price: $5.00 (a bearish drift of about 10% from $5.56)
- Expected Range: $4.10 to $6.40 (width $2.30, about 41% of current price. This is deliberately wider than the formula's 12-18% because ATR is ~8.7% of price, and it also reflects the two-sided risk of a bounce toward the EMA21.)
- Key Levels: Support at $5.00, Resistance at $6.48
OVERALL BIAS
OVERALL BIAS: BEARISH - Price is below the lower Bollinger Band and under every moving average, with ADX at 32.6 and −DI (31.8) far above +DI (13.0), a strong, intensifying downtrend. The mild RSI divergence and neutral CMF argue for a possible bounce toward $6.40-$6.50, but rallies into the EMA21 should be sold unless price reclaims it.
This is educational analysis and not financial advice.