QUBT 62-day bearish forecast — Nov 15, 2026
- Bias: Bearish
- Timeframe: 62 days (made Nov 15, 2026, target date Jan 15, 2027)
- Price at analysis: $5.56
- Price target: $5.00
- Expected range: $4.20 – $6.40
- Result: Pending — graded after the close on Jan 15, 2027
Get a free AI analysis of QUBT today
Analysis
TECHNICAL INDICATORS
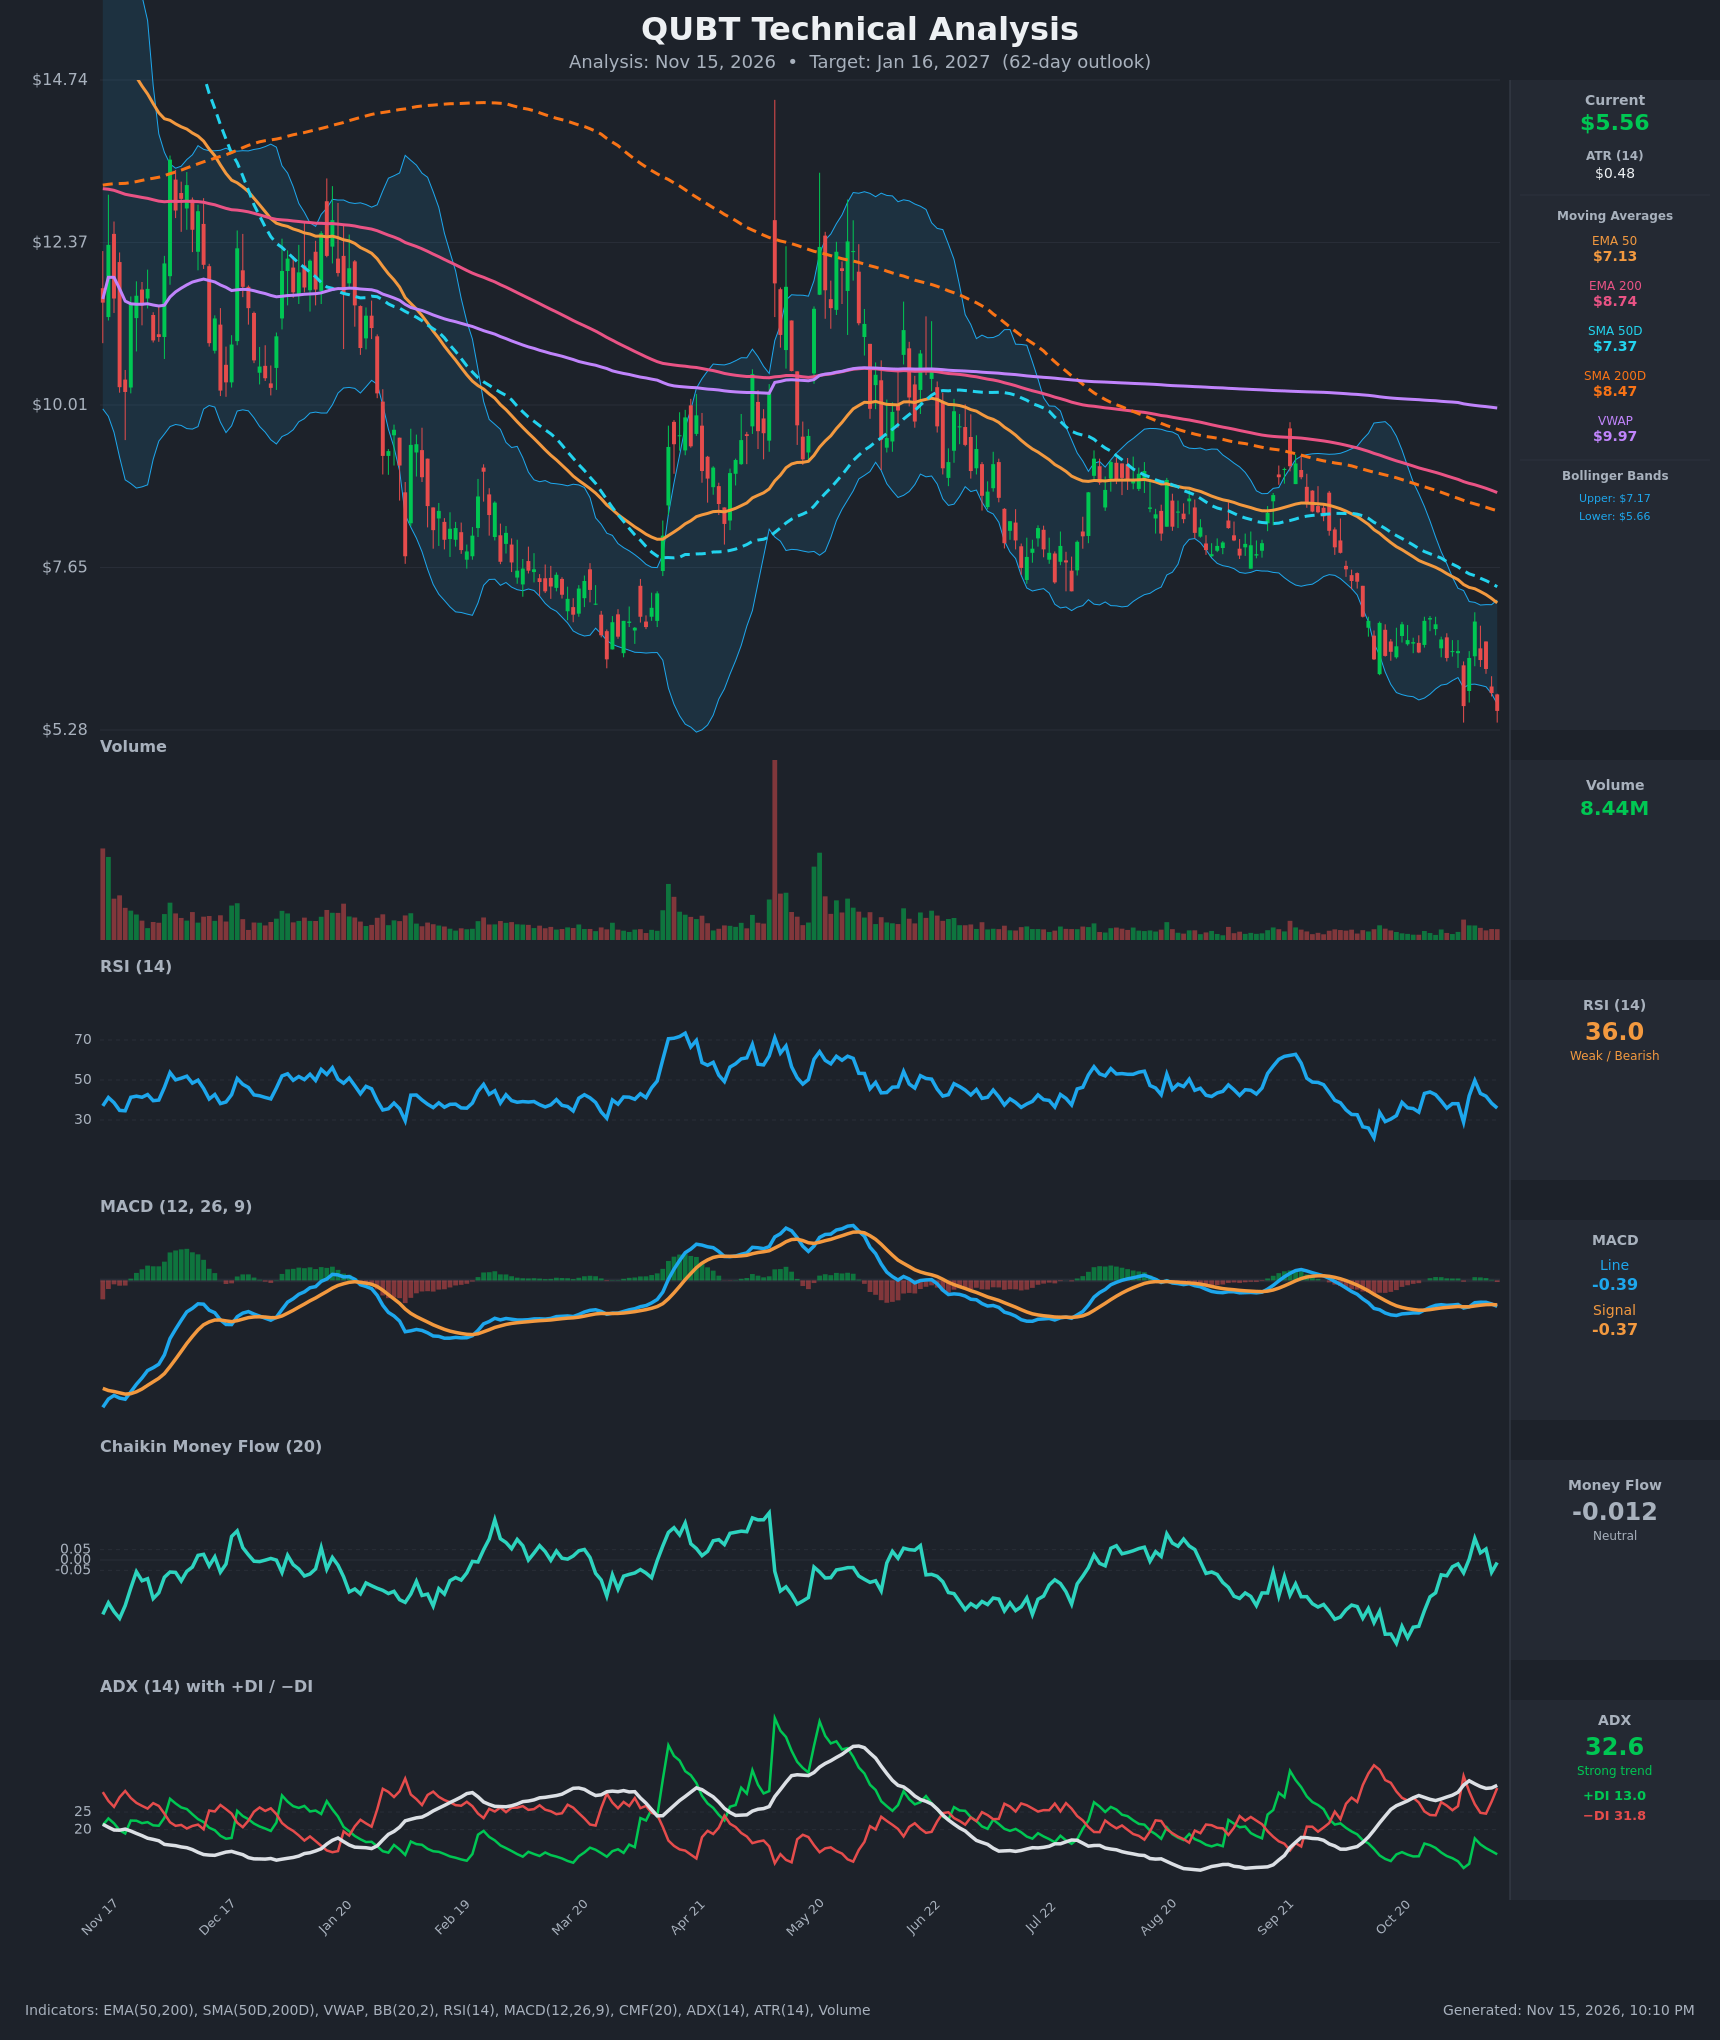
- RSI (14): 35.97, below the neutral 50 line and approaching oversold (<30). It briefly touched 28.9 on Nov 5, bounced to 49.8 on Nov 9, and has rolled over again. Momentum is weak and the bounces keep failing near 50. [Bearish]
- 20 EMA: The 20 EMA isn't supplied. The Bollinger midline (the 20-period average) sits around $6.4, and price at $5.56 is well below it. EMA50 at $7.13 and SMA50D at $7.37 are overhead and falling, so they act as resistance. [Bearish]
- MACD: The line at -0.389 is below the signal at -0.367, a fresh bearish crossover on Nov 13 after a brief bullish cross on Nov 6-9. Both lines are negative and the histogram is turning negative (about -0.02). Momentum is shallow but fading. [Bearish]
- Bollinger Bands (20): Upper $7.17, lower $5.66. Price at $5.56 is below the lower band, a walk-the-band or breakdown condition. In a strong downtrend this signals trend continuation, though it also raises the odds of a short-term mean-reversion bounce toward the midline near $6.4. [Bearish]
- CMF (20): -0.012, neutral (between ±0.05). It has recovered from deeply negative readings in October (-0.32) but failed to hold above +0.05, so buying pressure has not been convincing. [Neutral]
- ADX (14): 32.6 and rising from 29.7, so the trend is strong. −DI (31.8) is far above +DI (13.0), meaning bears are firmly in control. [Strong Trend – Bearish]
- Volume: 8.44M, subdued and well below the spikes seen earlier in the year. Declines are not accompanied by capitulation volume, so the selloff is orderly rather than exhausted, with no volume-based reversal signal yet. [Neutral to Mildly Bearish]
DIVERGENCES & TRENDS
- Moving averages: Price ($5.56) is below EMA50 ($7.13), EMA200 ($8.74), SMA50D ($7.37), SMA200D ($8.47) and VWAP ($9.97). EMA50 is below EMA200 and SMA50D is below SMA200D, so the death cross is already in place and the spread is still widening. All of the averages are sloping down.
- Price structure: The chart shows a series of lower highs and lower lows from the ~$14 area to the $5.28-5.56 zone. The Nov 5 low of $5.63 has now been undercut by the $5.56 close.
- RSI divergence: There is no bullish divergence. RSI's Nov 5 low (28.9) was lower than the current reading, but price is now lower than on Nov 5 while RSI is higher (36 vs 28.9). That is a mild bullish divergence, though a weak one, since RSI sat at 49.8 only days ago and the bounce failed.
- MACD: The bearish crossover on Nov 13 followed a failed attempt to turn up. MACD remains in negative territory with no sign of a trend change.
- CMF: Money flow improved from -0.32 to roughly zero without turning positive, a sign of selling pressure easing but not of accumulation.
- ADX/DI: −DI has stayed above +DI for the entire recent window, and ADX is rising again. This confirms a persistent downtrend.
CHART PATTERNS
- Dominant structure: A long-running downtrend with a series of lower highs, consistent with a Descending Triangle / bearish continuation bias if the $5.3-5.6 floor breaks. Price is currently testing and slightly breaking the lower Bollinger Band and the recent lows, which resemble a flat support base.
- Recent consolidation: From late October to mid-November price ranged roughly $5.63-$6.91 after the sharp drop. This is a loose Bearish Flag/Rectangle after the steep decline from ~$9. A measured move from that flag (the pole is about $2.5-3) points to the $4.50-$5.00 zone if support fails.
- Bullish alternative: Bullish reversal patterns (double bottom, falling wedge) are not confirmed. The $5.28-5.63 area is a potential double-bottom base, but it would need a close above about $6.9 to confirm. Price would need to hold above $5.28 to keep that setup alive.
POTENTIAL SCENARIOS
- Scenario 1: Bearish Trend Continuation — Price breaks below the $5.28-5.50 support with ADX >30 and −DI dominant, and the death-cross structure keeps pressure on rallies. The flag measured move targets the ~$4.50-5.00 area. Trigger: daily close below $5.28 on rising volume. Target: $4.60-$5.00. Invalidation: daily close above $6.40 (Bollinger midline) followed by $7.17. (50% probability)
- Scenario 2: Neutral/Bullish Oversold Bounce and Range — Price finds a base near $5.28-5.50 as RSI approaches oversold, and a mean-reversion rally pushes toward the Bollinger midline and EMA50. Resistance at $6.40-$7.13 then caps the move. Trigger: RSI turning up from <30 with a MACD bullish cross and a close back above $6.00. Target: $6.40-$7.10. Invalidation: close below $5.28. (30% probability)
- Scenario 3: Bullish Trend Reversal — A volume-backed breakout above $6.90 and the SMA50 ($7.37) confirms a double-bottom and +DI crossing above −DI. Trigger: close above $7.40 with CMF >+0.05. Target: $8.40-$8.70 (SMA200D/EMA200). Invalidation: failure at $7.37 and a drop below $6.00. (20% probability)
PRICE TARGETS
- Target Price: $5.00 (62-day horizon, Jan 16, 2027)
- Expected Range: $4.20 to $6.40 (width $2.20 ≈ 39.6% of the current price, which is wider than the 18-30% guideline for 61-180 days. This reflects QUBT's high volatility, with ATR at $0.48 or ~8.7% of price. Self-check: the ~$2.20 width is still far larger than any 2-3 day range.)
- Key Levels: Support at $5.28, Resistance at $6.40
OVERALL BIAS
OVERALL BIAS: BEARISH - Price is below every major moving average and below the lower Bollinger Band. The death cross is in place, ADX is 32.6 and rising with −DI (31.8) far above +DI (13.0), and MACD just crossed down. Neutral CMF and a mild RSI divergence leave room for an oversold bounce, but the trend favors lower prices toward $5.00.
This is educational analysis and not financial advice.