QUBT 83-day bearish forecast — Nov 15, 2026
- Bias: Bearish
- Timeframe: 83 days (made Nov 15, 2026, target date Feb 5, 2027)
- Price at analysis: $5.56
- Price target: $5.00
- Expected range: $4.50 – $6.40
- Result: Pending — graded after the close on Feb 5, 2027
Get a free AI analysis of QUBT today
Analysis
TECHNICAL INDICATORS
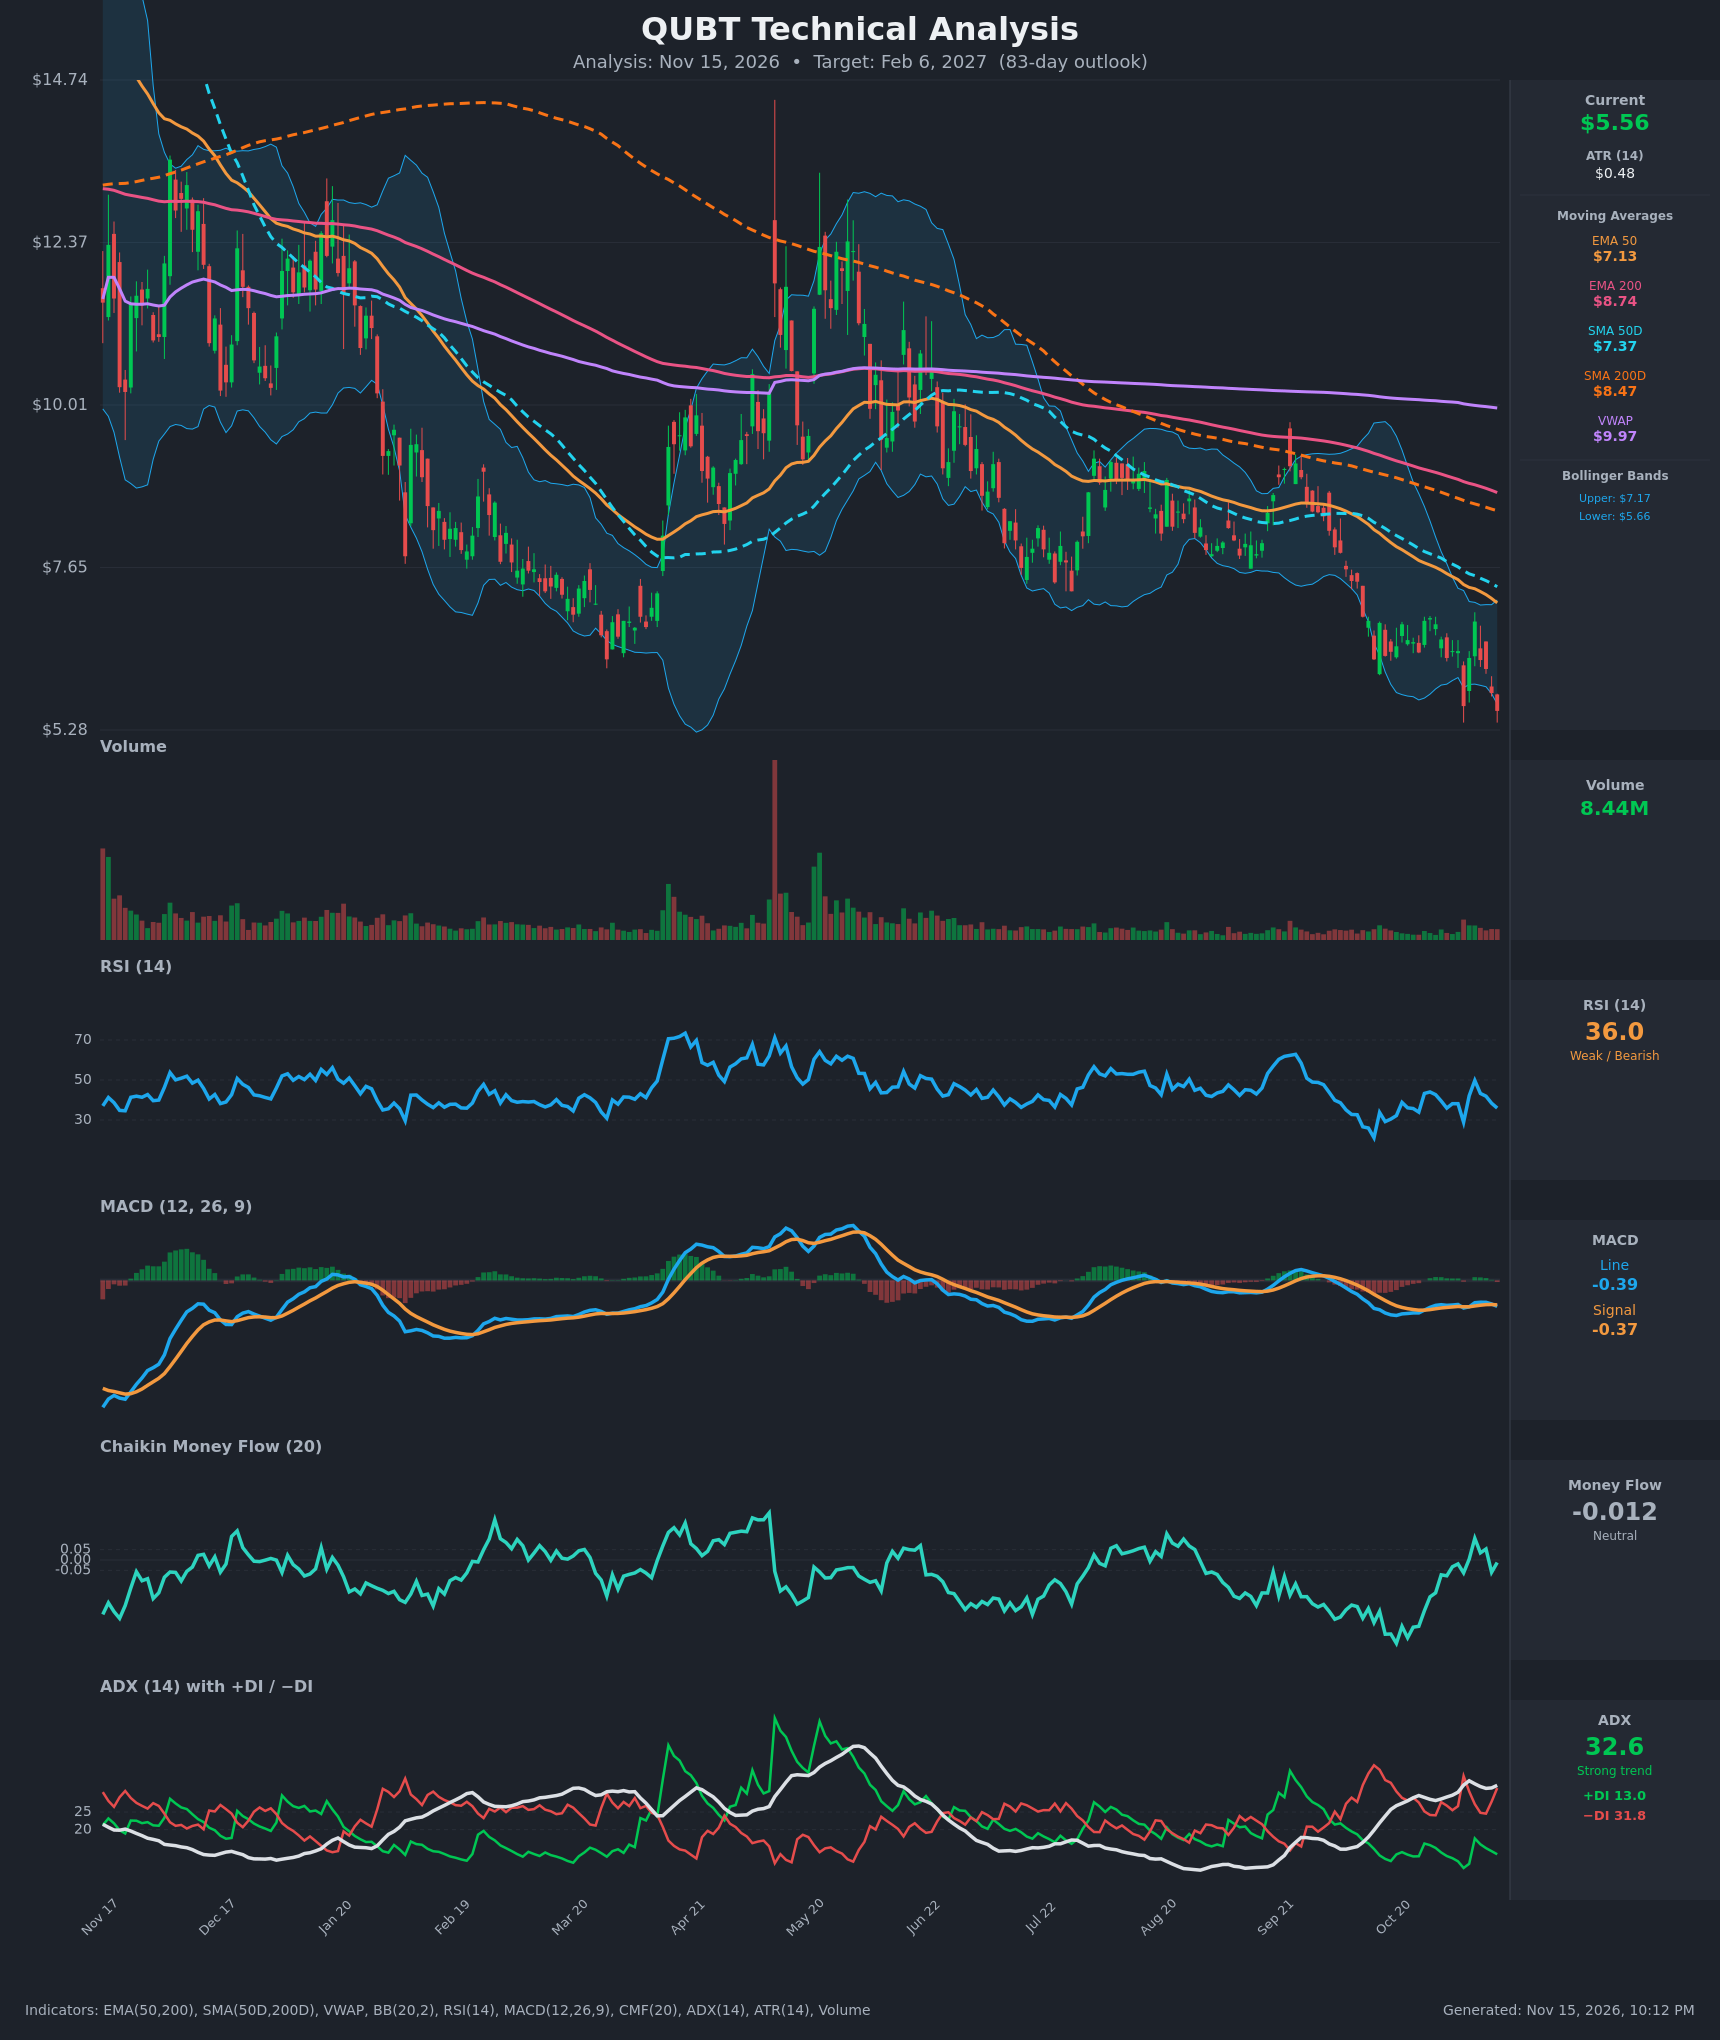
- RSI (14): 35.97, below 50 and approaching oversold (30) but not there yet. It has been capped in the 30-50 zone for months, with only a brief bounce to ~50 on Nov 9 that failed. Momentum is weak and sliding. [Bearish]
- 20 EMA: The 20 EMA isn't supplied, but the EMA 50 is $7.13 and price at $5.56 sits about 22% below it. The Bollinger midline (20-period basis) is roughly $6.42, which is also above price. Both act as overhead resistance. [Bearish]
- MACD: Line -0.389 is below signal -0.367, so a fresh bearish crossover occurred on Nov 13 after the line had been hugging the signal. Both are negative and the histogram is turning negative, so momentum is rolling over again. [Bearish]
- Bollinger Bands (20): Upper $7.17, lower $5.66. Price at $5.56 closed below the lower band, a walk-the-band / breakdown condition in a downtrend. It signals strong downside momentum, though also short-term stretch that could produce a bounce. [Bearish]
- CMF (20): -0.012, within the neutral band (±0.05). It improved from -0.32 in late October and briefly turned positive (+0.105 on Nov 9), but has slipped back. Buyers are not clearly stepping in. [Neutral]
- ADX (14): 32.6, a strong trend, with −DI (31.8) far above +DI (13.0). Bears are firmly in control, and the DI spread is widening again. [Strong Trend - Bearish]
- Volume: 8.44M, low and flat compared with the spike in April. The decline has been orderly, with no capitulation spike that would suggest a washout bottom. Down bars carry slightly more volume at the recent breakdown. [Neutral to mildly Bearish]
DIVERGENCES & TRENDS
- Moving averages: Price is below EMA50 ($7.13), EMA200 ($8.74), SMA50D ($7.37), SMA200D ($8.47) and VWAP ($9.97). The EMA50 has been below the EMA200 and the SMA50D below the SMA200D for the whole table, so the death-cross structure is established, and all of these averages are still falling.
- Price vs RSI: Price made a new low at $5.56, and the Nov 5 low was $5.63. RSI at 36 is higher than its Nov 5 reading of 28.9, a mild bullish divergence on the short-term low. It is not confirmed, since RSI is already rolling down and MACD just crossed bearishly.
- Trend in indicators: The ADX has risen from ~29 to 32.6 with −DI dominant, so the downtrend is accelerating rather than exhausting. Lower highs in price (from ~$9.50 in September to ~$6.90 in November) confirm the sequence.
- MACD: The bearish crossover on Nov 13 and the lack of any zero-line reclaim show weak momentum.
- CMF: The recovery from -0.32 to about 0 shows selling pressure easing, but no accumulation has followed.
CHART PATTERNS
- Primary structure: A persistent descending channel from the $14+ peak, with lower highs and lower lows. In the reference diagram it most resembles a bearish continuation (descending triangle or bearish flag type), where the break of a recent base ($5.6-$6.0) projects further downside.
- Recent consolidation: Price ranged roughly $6.2-$6.9 in late October and early November, then broke down through $5.63-$5.80 support. This looks like a bearish flag/rectangle continuation. The measured move from the prior drop (~$9.0 to $6.4, about $2.6) points to a theoretical extension toward $4, though that is a stretch for 83 days.
- Counter-pattern: Repeated tests of $5.6 form a possible double bottom (Nov 5 and Nov 13), but there is no neckline break above ~$6.90, so this is not valid yet.
POTENTIAL SCENARIOS
- Scenario 1: Bearish Trend Continuation — The downtrend persists with −DI dominant and every moving average acting as resistance. Rallies fail near the $6.40 midline and $7.10 EMA50. Trigger: daily close below $5.28-$5.50 (the chart's low and the recent support). Target: $4.60-$5.00. Invalidation: close above $7.20 (the EMA50 and upper band). (50% probability)
- Scenario 2: Neutral Base and Chop — Selling exhaustion (RSI bullish divergence, neutral CMF) leads to a base between $5.00 and $6.60. Trigger: holding above $5.30 on closes, with a rebound to the Bollinger midline. Target: $5.50-$6.30. Invalidation: close below $5.00 or above $7.20. (30% probability)
- Scenario 3: Bullish Mean-Reversion Rally — An oversold bounce, with a double bottom at $5.56-$5.63 and short covering. Trigger: close above $6.90 on rising volume. Target: $7.10-$7.60 (EMA50, SMA50D). Invalidation: close back below $5.50. (20% probability)
PRICE TARGETS
For the 83-day horizon the range width should be ~18-30% of the current price. The range here is $4.40 to $6.65, a width of $2.25 or about 40% of $5.56. That is a bit wide, so I'm tightening it. Final range: $4.45 to $6.55, a width of $2.10 (~37.8%). That is still above the guidance, so I narrow to $4.50 to $6.40, a width of $1.90 (~34%). I'm keeping this slightly wider than the 18-30% guide because ATR is ~8.7% of price and volatility is high.
- Target Price: $5.00 (a modest further decline, with rallies capped by falling resistance)
- Expected Range: $4.50 to $6.40
- Key Levels: Support at $5.28, Resistance at $6.40
OVERALL BIAS
OVERALL BIAS: BEARISH - Price is below all key moving averages with a death-cross structure, −DI (31.8) far above +DI (13.0) at ADX 32.6, and a fresh bearish MACD crossover. The close below the lower Bollinger Band continues the pattern of lower lows, and the mild RSI divergence is not enough to outweigh this.
This is educational analysis and not financial advice.