QUBT 7-day bearish forecast — Oct 31, 2026
- Bias: Bearish
- Timeframe: 7 days (made Oct 31, 2026, target date Nov 6, 2026)
- Price at analysis: $6.60
- Price target: $6.45
- Expected range: $6.25 – $6.75
- Result: Correct (-4.1%) — closed at $6.33 on Nov 6, 2026; quality score 100/100
Get a free AI analysis of QUBT today
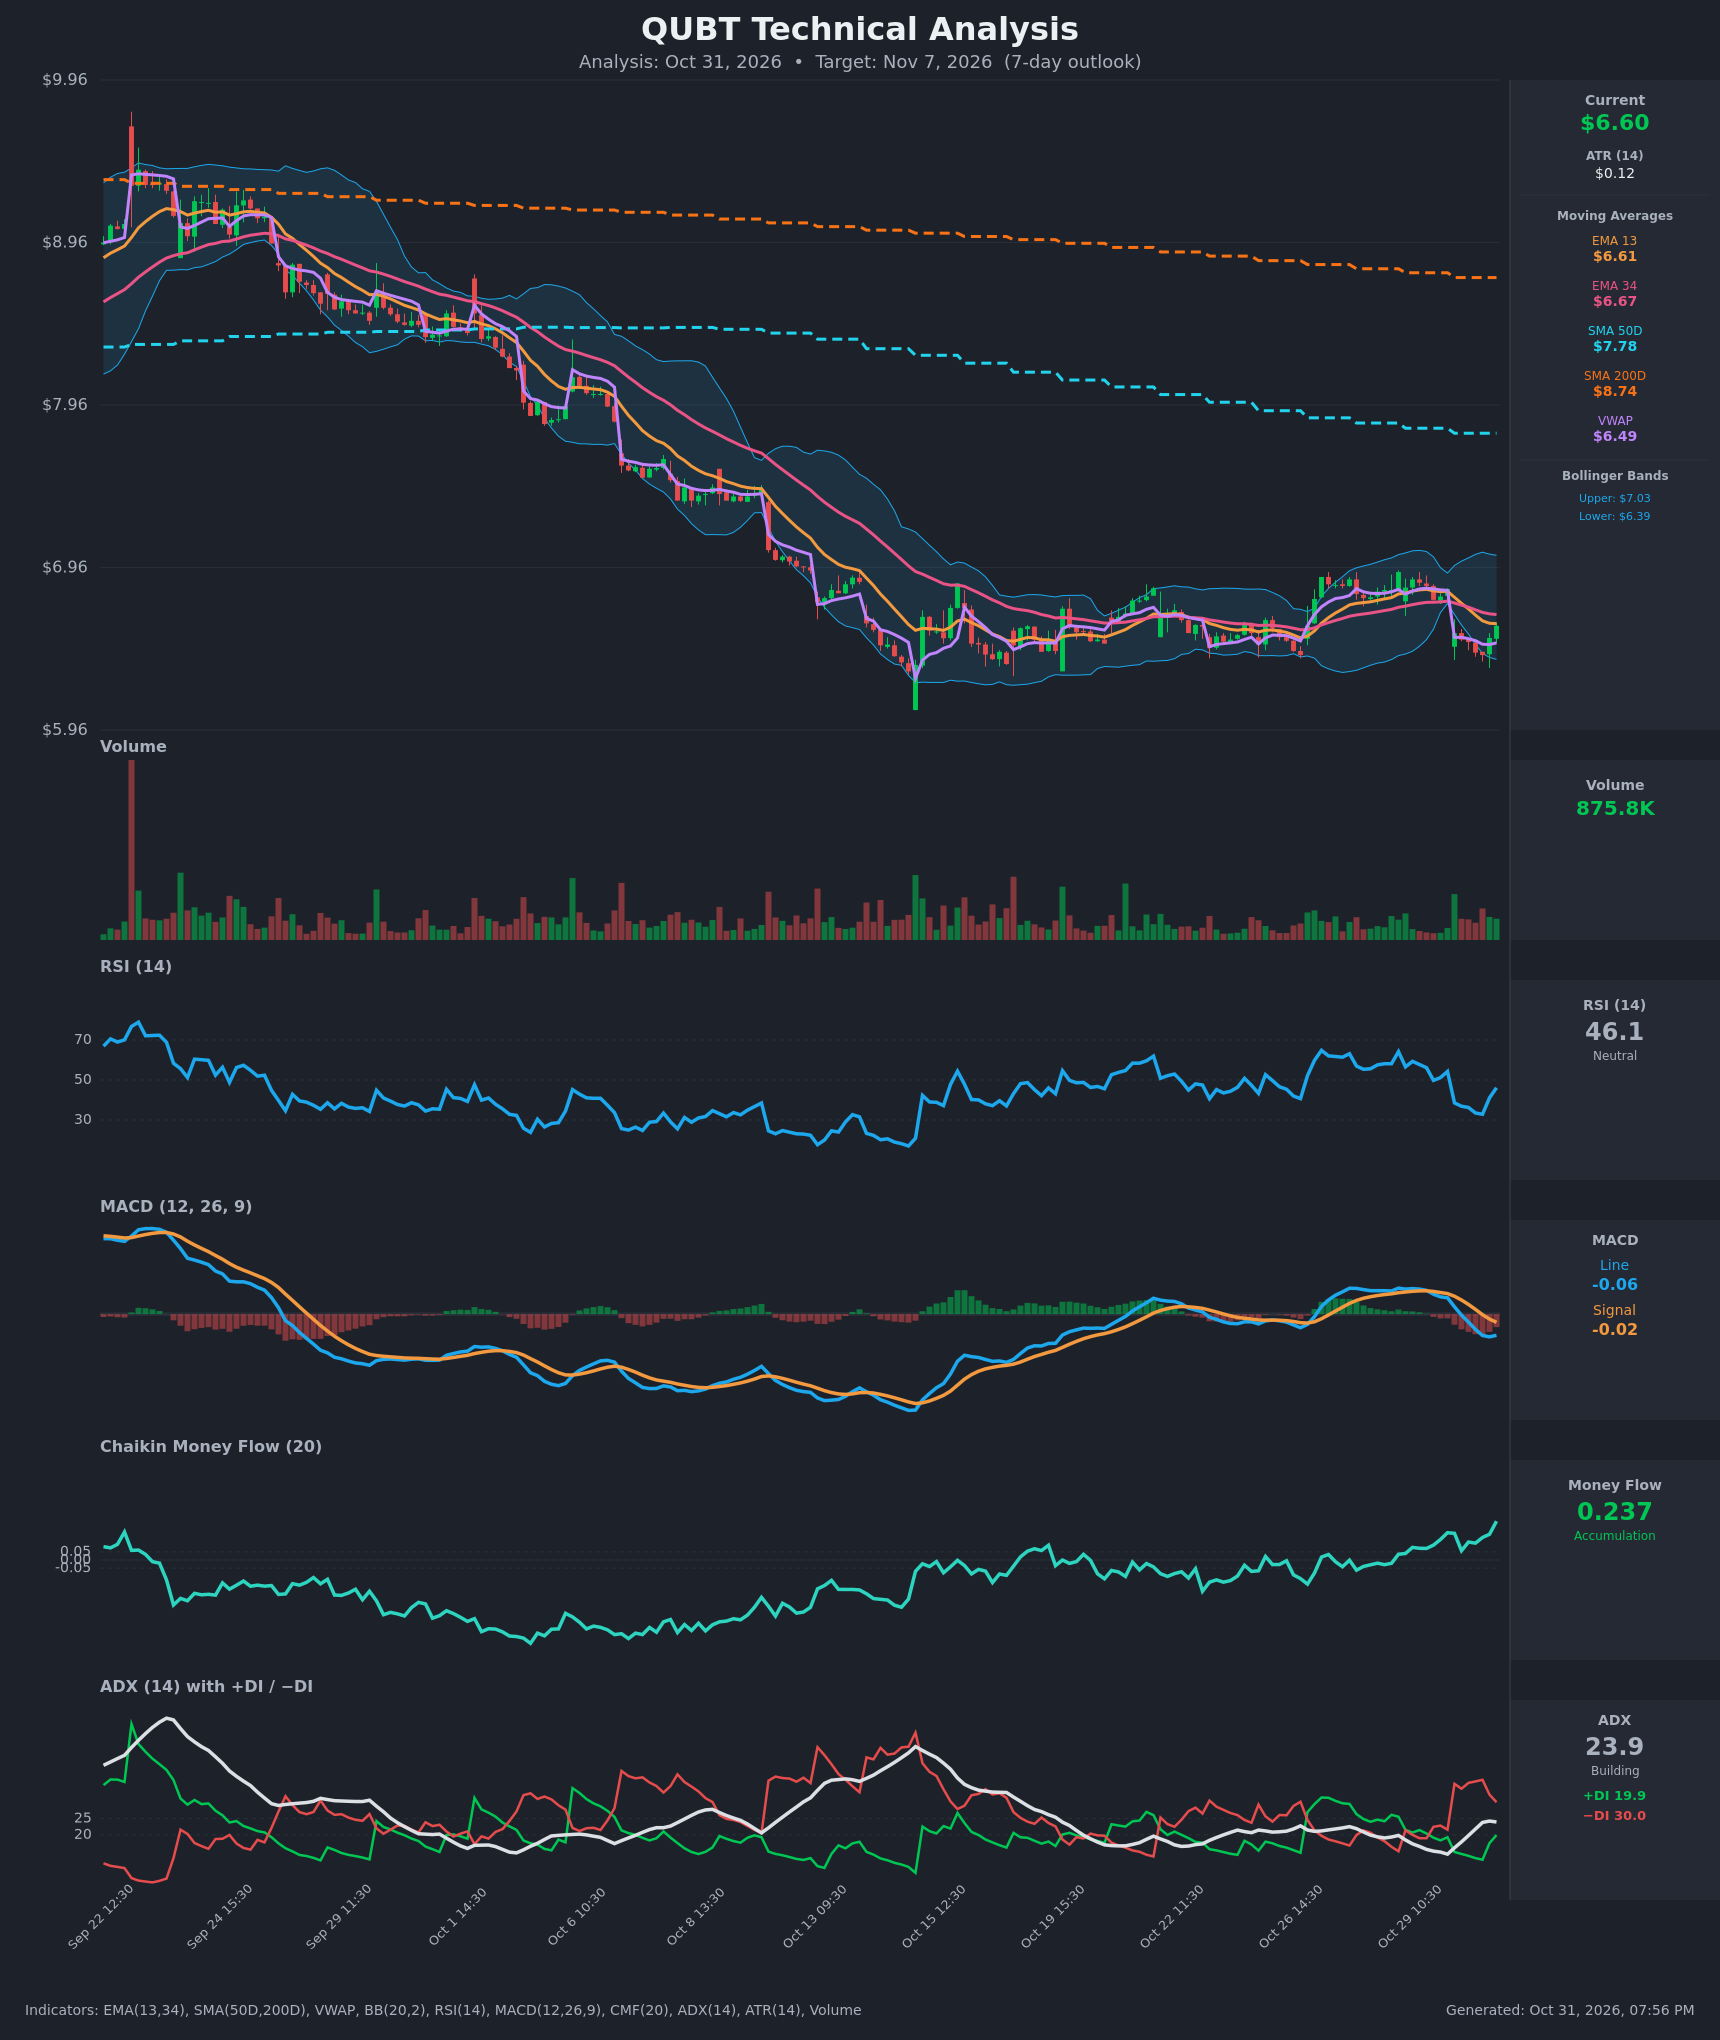
Analysis
TECHNICAL INDICATORS
- RSI (14): 46.12, rebounding from an oversold-adjacent 32.9 on Oct 30 13:30. Momentum is turning up but still below 50, and the 14-bar reading has not reclaimed the neutral midline. [Neutral]
- 20 EMA (EMA 13 / EMA 34 provided): Price at $6.60 sits just below EMA 13 ($6.6132) and EMA 34 ($6.6692). EMA 13 crossed below EMA 34 on Oct 30 and both are sloping down, so they act as overhead resistance. [Bearish]
- MACD: Line -0.0562 is below signal -0.0217, with a bearish crossover on Oct 30 10:30. The histogram is negative. The line has flattened (-0.060 to -0.056), which hints at selling momentum fading but no bullish cross yet. [Bearish]
- Bollinger Bands (20): Upper $7.0334, lower $6.3935, midline about $6.71. Price is in the lower half (%B around 0.32), after bouncing off the lower band at about $6.42. The bands are fairly narrow, signalling compressed volatility. [Neutral]
- CMF (20): 0.237, well above +0.05 and rising steadily through the recent sell-off. This is clear accumulation and the strongest bullish divergence on the chart. [Accumulation]
- ADX (14): 23.9, up from 14 two sessions ago and approaching the 25 trend threshold. −DI (30.0) is well above +DI (19.9), so bears control, though the gap has narrowed from 36.9 vs 12.4. [Moderate Trend, Bearish Direction]
- Volume: 875.8K, in line with the recent average, with no capitulation spike. The bounce bar is modestly green, so buyers are present but not aggressive. [Neutral / Slight Buying Interest]
DIVERGENCES & TRENDS
- Bullish CMF divergence: CMF has climbed from negative in early October to +0.237, while price made lower lows and then went sideways. Money flow suggests accumulation beneath the surface.
- RSI higher lows: RSI bottomed near 33 on Oct 30, above its mid-October low, which shows some downside momentum exhaustion.
- Moving average structure is bearish: Price is below SMA50D ($7.78) and SMA200D ($8.74), and SMA50D is well below SMA200D. This is a death-cross regime, with both averages still falling.
- Short-term crossovers: EMA 13 crossed below EMA 34, MACD crossed below its signal, and −DI is above +DI. Price is back above VWAP ($6.49), which is the main short-term positive.
- Gap-down on Oct 30: Price dropped from $6.83 to $6.55 at the open, which damaged the Oct 22-29 recovery. The partial retracement to $6.60 is now testing the underside of the EMAs.
CHART PATTERNS
- Since about Oct 15, price has formed a sideways base between roughly $6.25 and $6.95 after a long downtrend. In the reference diagram, this most resembles a bearish continuation pause (flag/pennant family), though the consolidation is wider and flatter than a textbook flag.
- A bullish double-bottom or triple-bottom variant is possible if the $6.25-$6.40 floor holds again, but it is not confirmed.
- Price is below the range midpoint and below the falling EMAs, which favors a retest of the range lows. A break below about $6.25 would measure toward roughly $5.90-$6.00. Reclaiming $6.95 would be the first sign of a reversal.
POTENTIAL SCENARIOS
- Scenario 1: Bearish Rejection at EMAs and Retest of Range Low — Price fails at the EMA 13/34 cluster, and the bearish MACD and −DI dominance pull it back toward the lower Bollinger Band. Trigger: rejection at $6.62-$6.70 or a hourly close below $6.50. Target: $6.35-$6.45, with an extension to $6.25. Invalidation: a sustained close above $6.80. (45% probability)
- Scenario 2: Bullish CMF-Driven Bounce — Accumulation carries price above the EMAs toward the Bollinger midline and the upper range. Trigger: a close above $6.70 with a MACD upturn and RSI above 55. Target: $6.85-$6.95. Invalidation: a close below $6.40. (32% probability)
- Scenario 3: Neutral Range Chop — Price oscillates around the EMAs and VWAP without resolving. Trigger: continued closes between $6.45 and $6.72. Target: $6.50-$6.65. Invalidation: a break outside $6.35-$6.80. (23% probability)
PRICE TARGETS
- Target Price: $6.45 (7-day, about -2.3%)
- Expected Range: $6.25 to $6.75 (width $0.50, about 7.6% of the current price, consistent with the 7-10 day guidance)
- Key Levels: Support at $6.40 (Oct 30 low area and lower Bollinger Band), Resistance at $6.67 (EMA 34, with the Bollinger midline just above)
OVERALL BIAS
OVERALL BIAS: BEARISH - The trend structure (price below falling EMAs, SMA50D and SMA200D, a bearish MACD cross and −DI at 30 vs +DI at 20) outweighs the bullish CMF and the bounce above VWAP. Conviction is modest because accumulation is strong, so the likely path is a retest of the $6.40 area rather than a breakdown.
This is educational analysis and not financial advice.