ARM 4-day bearish forecast — Oct 31, 2026
- Bias: Bearish
- Timeframe: 4 days (made Oct 31, 2026, target date Nov 3, 2026)
- Price at analysis: $205.91
- Price target: $202.50
- Expected range: $196.50 – $209.50
- Result: Correct (-1.5%) — closed at $202.85 on Nov 3, 2026; quality score 100/100
Get a free AI analysis of ARM today
Analysis
TECHNICAL INDICATORS
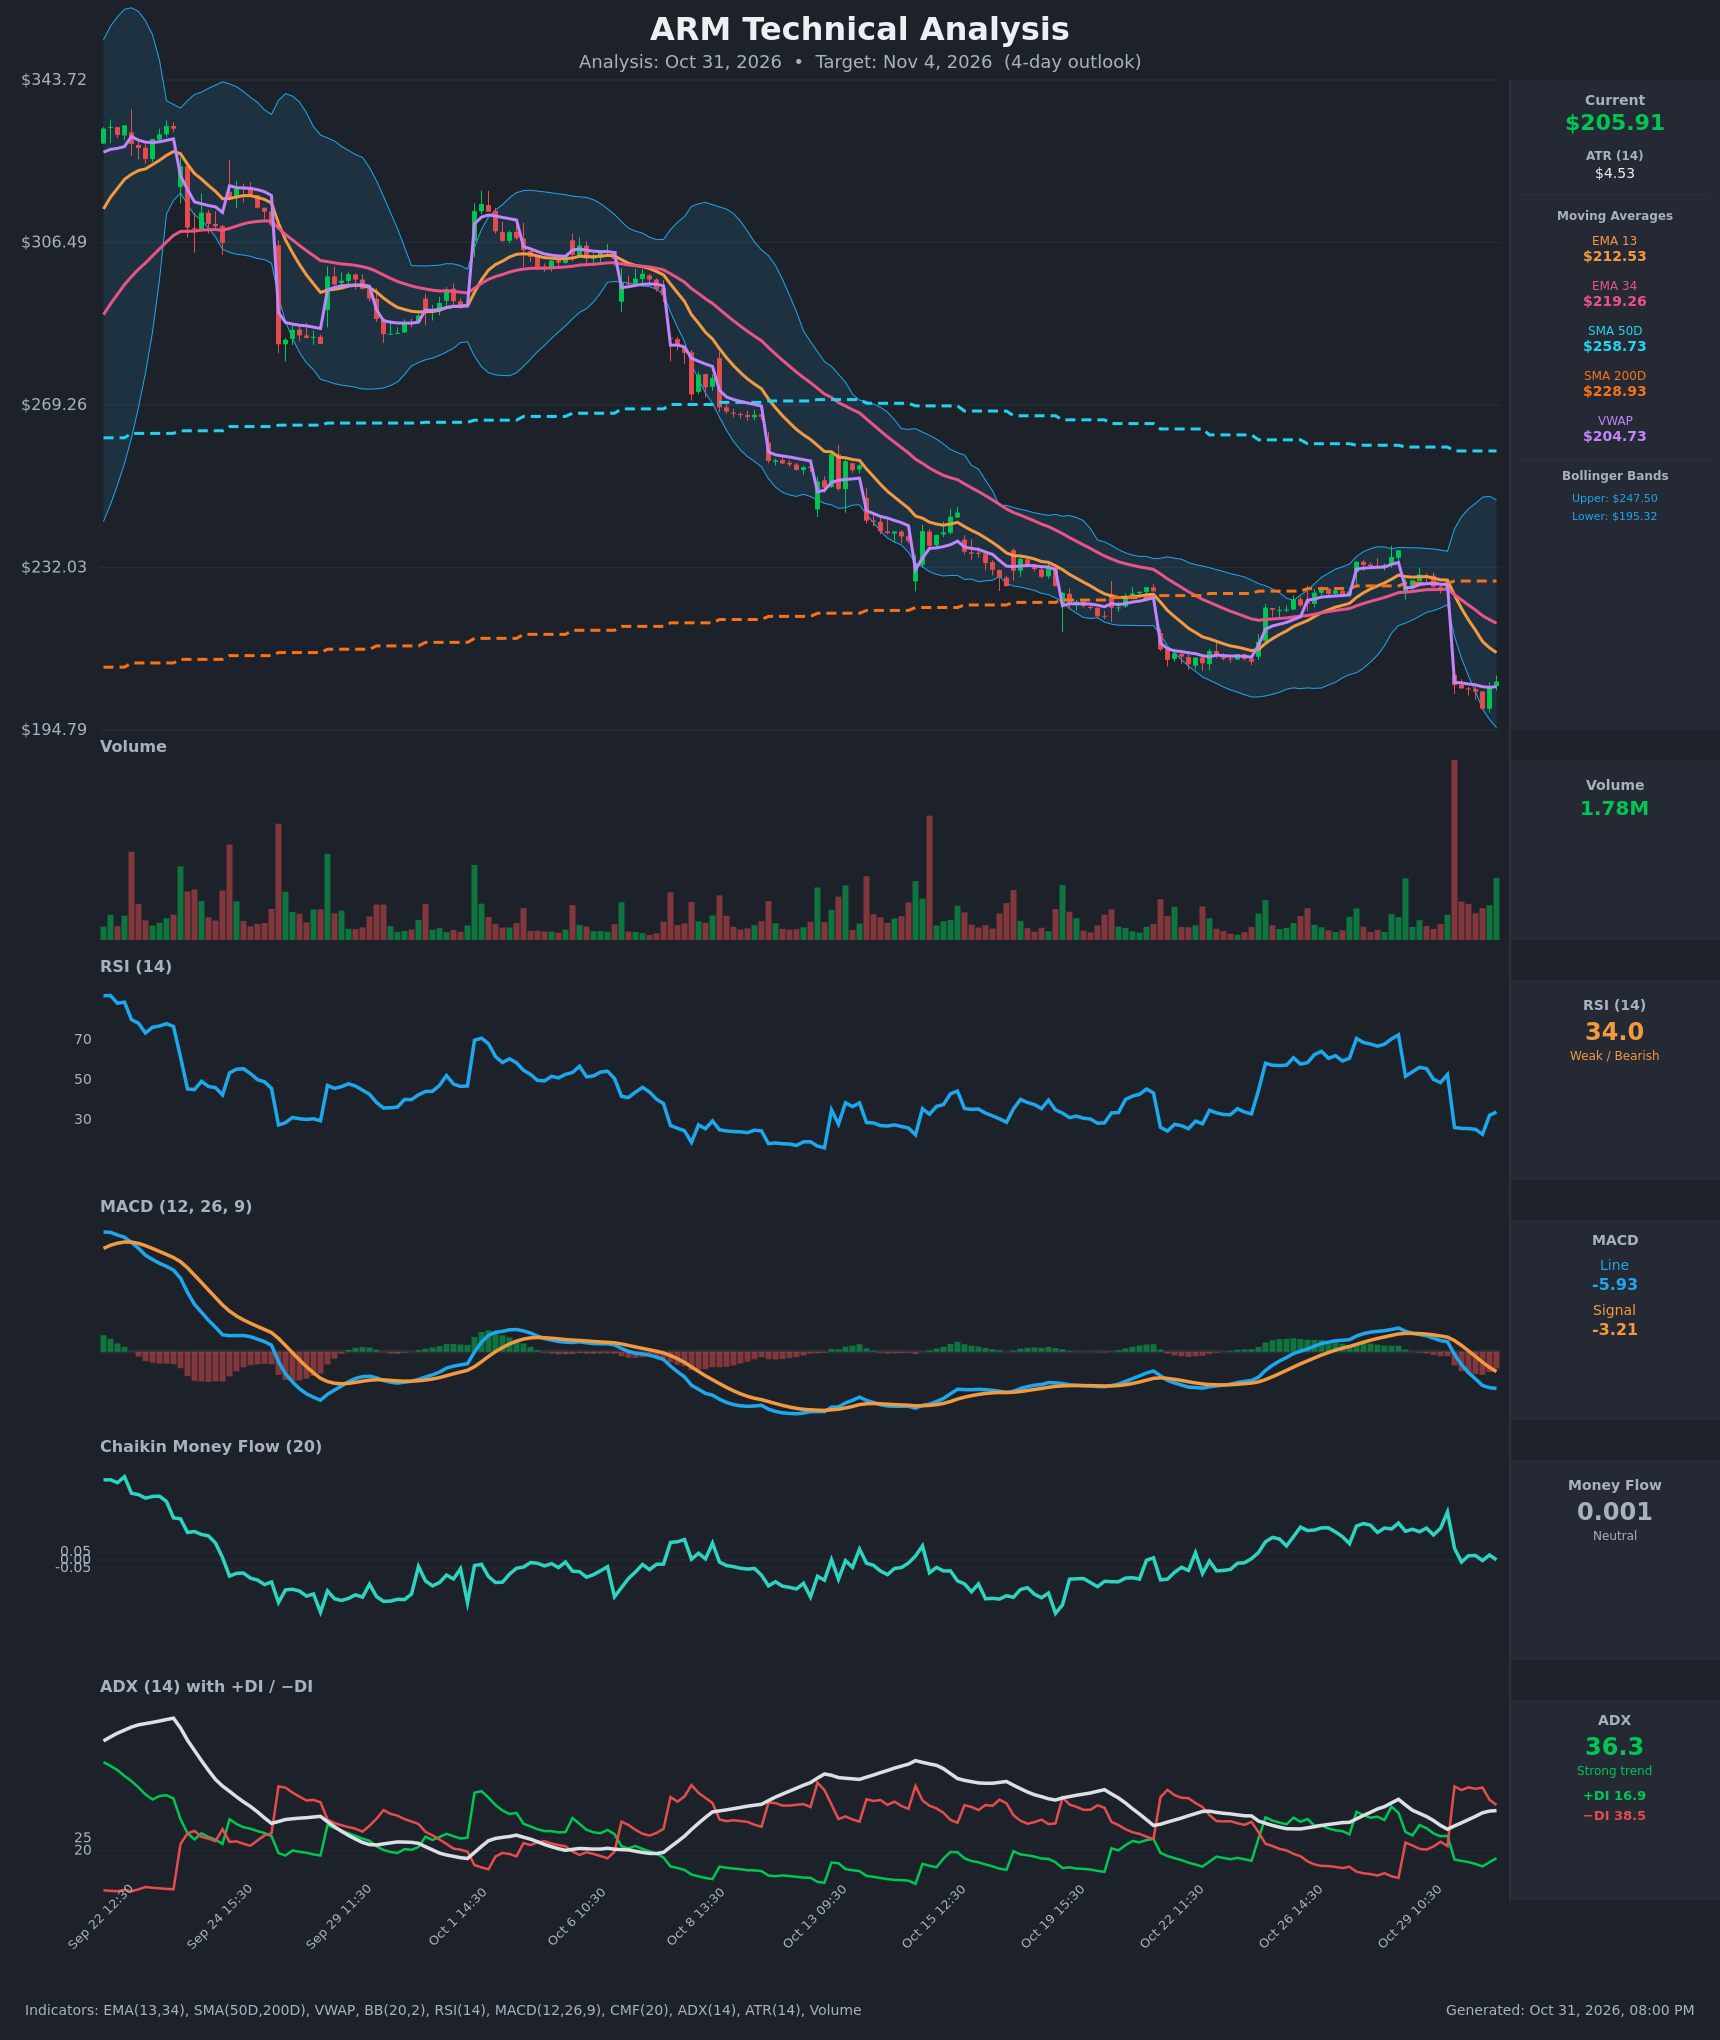
- RSI (14): 34.0, bouncing from an extreme 22.9 on Oct 30 13:30 but still below 50 and not yet out of the weak zone. Momentum is recovering off oversold, but the reading remains bearish. [Bearish]
- 20 EMA (EMA 13 / EMA 34 used): Price of $205.91 is below EMA 13 ($212.53) and EMA 34 ($219.26). EMA 13 is below EMA 34 and the gap is widening. Both are falling and act as overhead resistance. [Bearish]
- MACD: Line -5.93 is below Signal -3.21, so the histogram is negative and widening. The bearish crossover happened on Oct 30 around 12:30 and has not yet flattened. [Bearish]
- Bollinger Bands (20): Upper $247.50, lower $195.32. Price is in the lower quarter of the band, about $10 above the lower band. The bands are very wide after the gap-down, which signals elevated volatility. The price walked the lower band on the way down, and a bounce toward the mid-band is possible. [Bearish]
- CMF (20): 0.001, which is in the neutral band (±0.05). It has faded from +0.2–0.3 before the gap to flat, so buyers have not stepped in but there is no heavy distribution either. [Neutral]
- ADX (14): 36.3 and rising, with −DI at 38.5 far above +DI at 16.9. This is a strong downtrend with bears firmly in control. [Strong Trend – Bearish]
- Volume: 1.78M on the latest bar, which is green. It is far below the heavy-volume gap-down session (the largest spike on the chart). The post-gap bounce has come on modest volume, which makes it less convincing. [Weak bounce / Bearish-leaning]
DIVERGENCES & TRENDS
- There is no confirmed bullish divergence yet. RSI made a higher low (32.3 → 34.0) while price chopped around $200–206, but this is minor and needs follow-through.
- The trend is bearish across the board:
- Price is below SMA200D ($228.93) and far below SMA50D ($258.73).
- SMA50D is above SMA200D, but the spread is shrinking and a death cross is plausible in coming weeks.
- EMA 13 is below EMA 34.
- On Oct 30 the price gapped from $228.79 to $205.06 (about -10%). The MACD bearish crossover and the −DI surge (23 → 46) confirm the break.
- Price is trading just above VWAP ($204.73). Holding it is a minor positive, but VWAP is a session-reset level and carries limited weight.
- ADX is rising from 28 to 36 with −DI dominant, so trend strength is increasing, not exhausting.
CHART PATTERNS
- The main structure is the large post-gap move down followed by a small, tight consolidation around $200–206. This resembles a Bearish Pennant / Bearish Flag from the continuation set. A downside break implies a measured move that is too large for 4 days, but a first leg toward $196–199 is reasonable.
- The longer-term picture is a descending channel of lower highs and lower lows since the $340 area, with failed rallies at the EMA 34 and the SMA200D (Oct 26–29).
- A Bullish Falling Wedge would need a break above about $212 (EMA 13) to activate, and it is not confirmed.
POTENTIAL SCENARIOS
- Scenario 1: Bearish Pennant Breakdown — The small consolidation after the gap resolves lower with the trend, ADX and −DI dominance. Trigger: break and hold below $199.70 (the Oct 30 low). Target: $196–197 (lower Bollinger Band at $195.32), with an extension to $194. Invalidation: close back above $212.50 (EMA 13). (50% probability)
- Scenario 2: Bullish Oversold Relief Bounce — RSI recovers from the extreme low and price squeezes toward the EMA 13. Trigger: break above $208–209 on rising volume and a CMF move above +0.05. Target: $212.50–215. Invalidation: rejection at EMA 13 and a return below $204. (32% probability)
- Scenario 3: Neutral Post-Gap Range — Price drifts between roughly $200 and $209 as volatility cools. Trigger: no break of either boundary. Target: about $205. Invalidation: close outside $199.70–$209. (18% probability)
PRICE TARGETS
- Target Price: $202.50 (4-day horizon)
- Expected Range: $196.50 to $209.50 (width $13.00, about 6.3% of current price, which fits the 4-day timeframe)
- Key Levels: Support at $199.70, Resistance at $212.53
OVERALL BIAS
OVERALL BIAS: BEARISH - Price is below all key moving averages with a bearish MACD crossover, ADX at 36 and −DI (38.5) far above +DI (16.9). The post-gap bounce is on light volume with flat CMF, so a retest of the $199.70 low and the lower Bollinger Band is more likely than a recovery through $212.50. An oversold bounce remains a real risk given RSI near 34.
This is educational analysis and not financial advice.