ARM 34-day bearish forecast — Nov 15, 2026
- Bias: Bearish
- Timeframe: 34 days (made Nov 15, 2026, target date Dec 18, 2026)
- Price at analysis: $190.53
- Price target: $180.00
- Expected range: $158.00 – $204.00
- Result: Pending — graded after the close on Dec 18, 2026
Get a free AI analysis of ARM today
Analysis
TECHNICAL INDICATORS
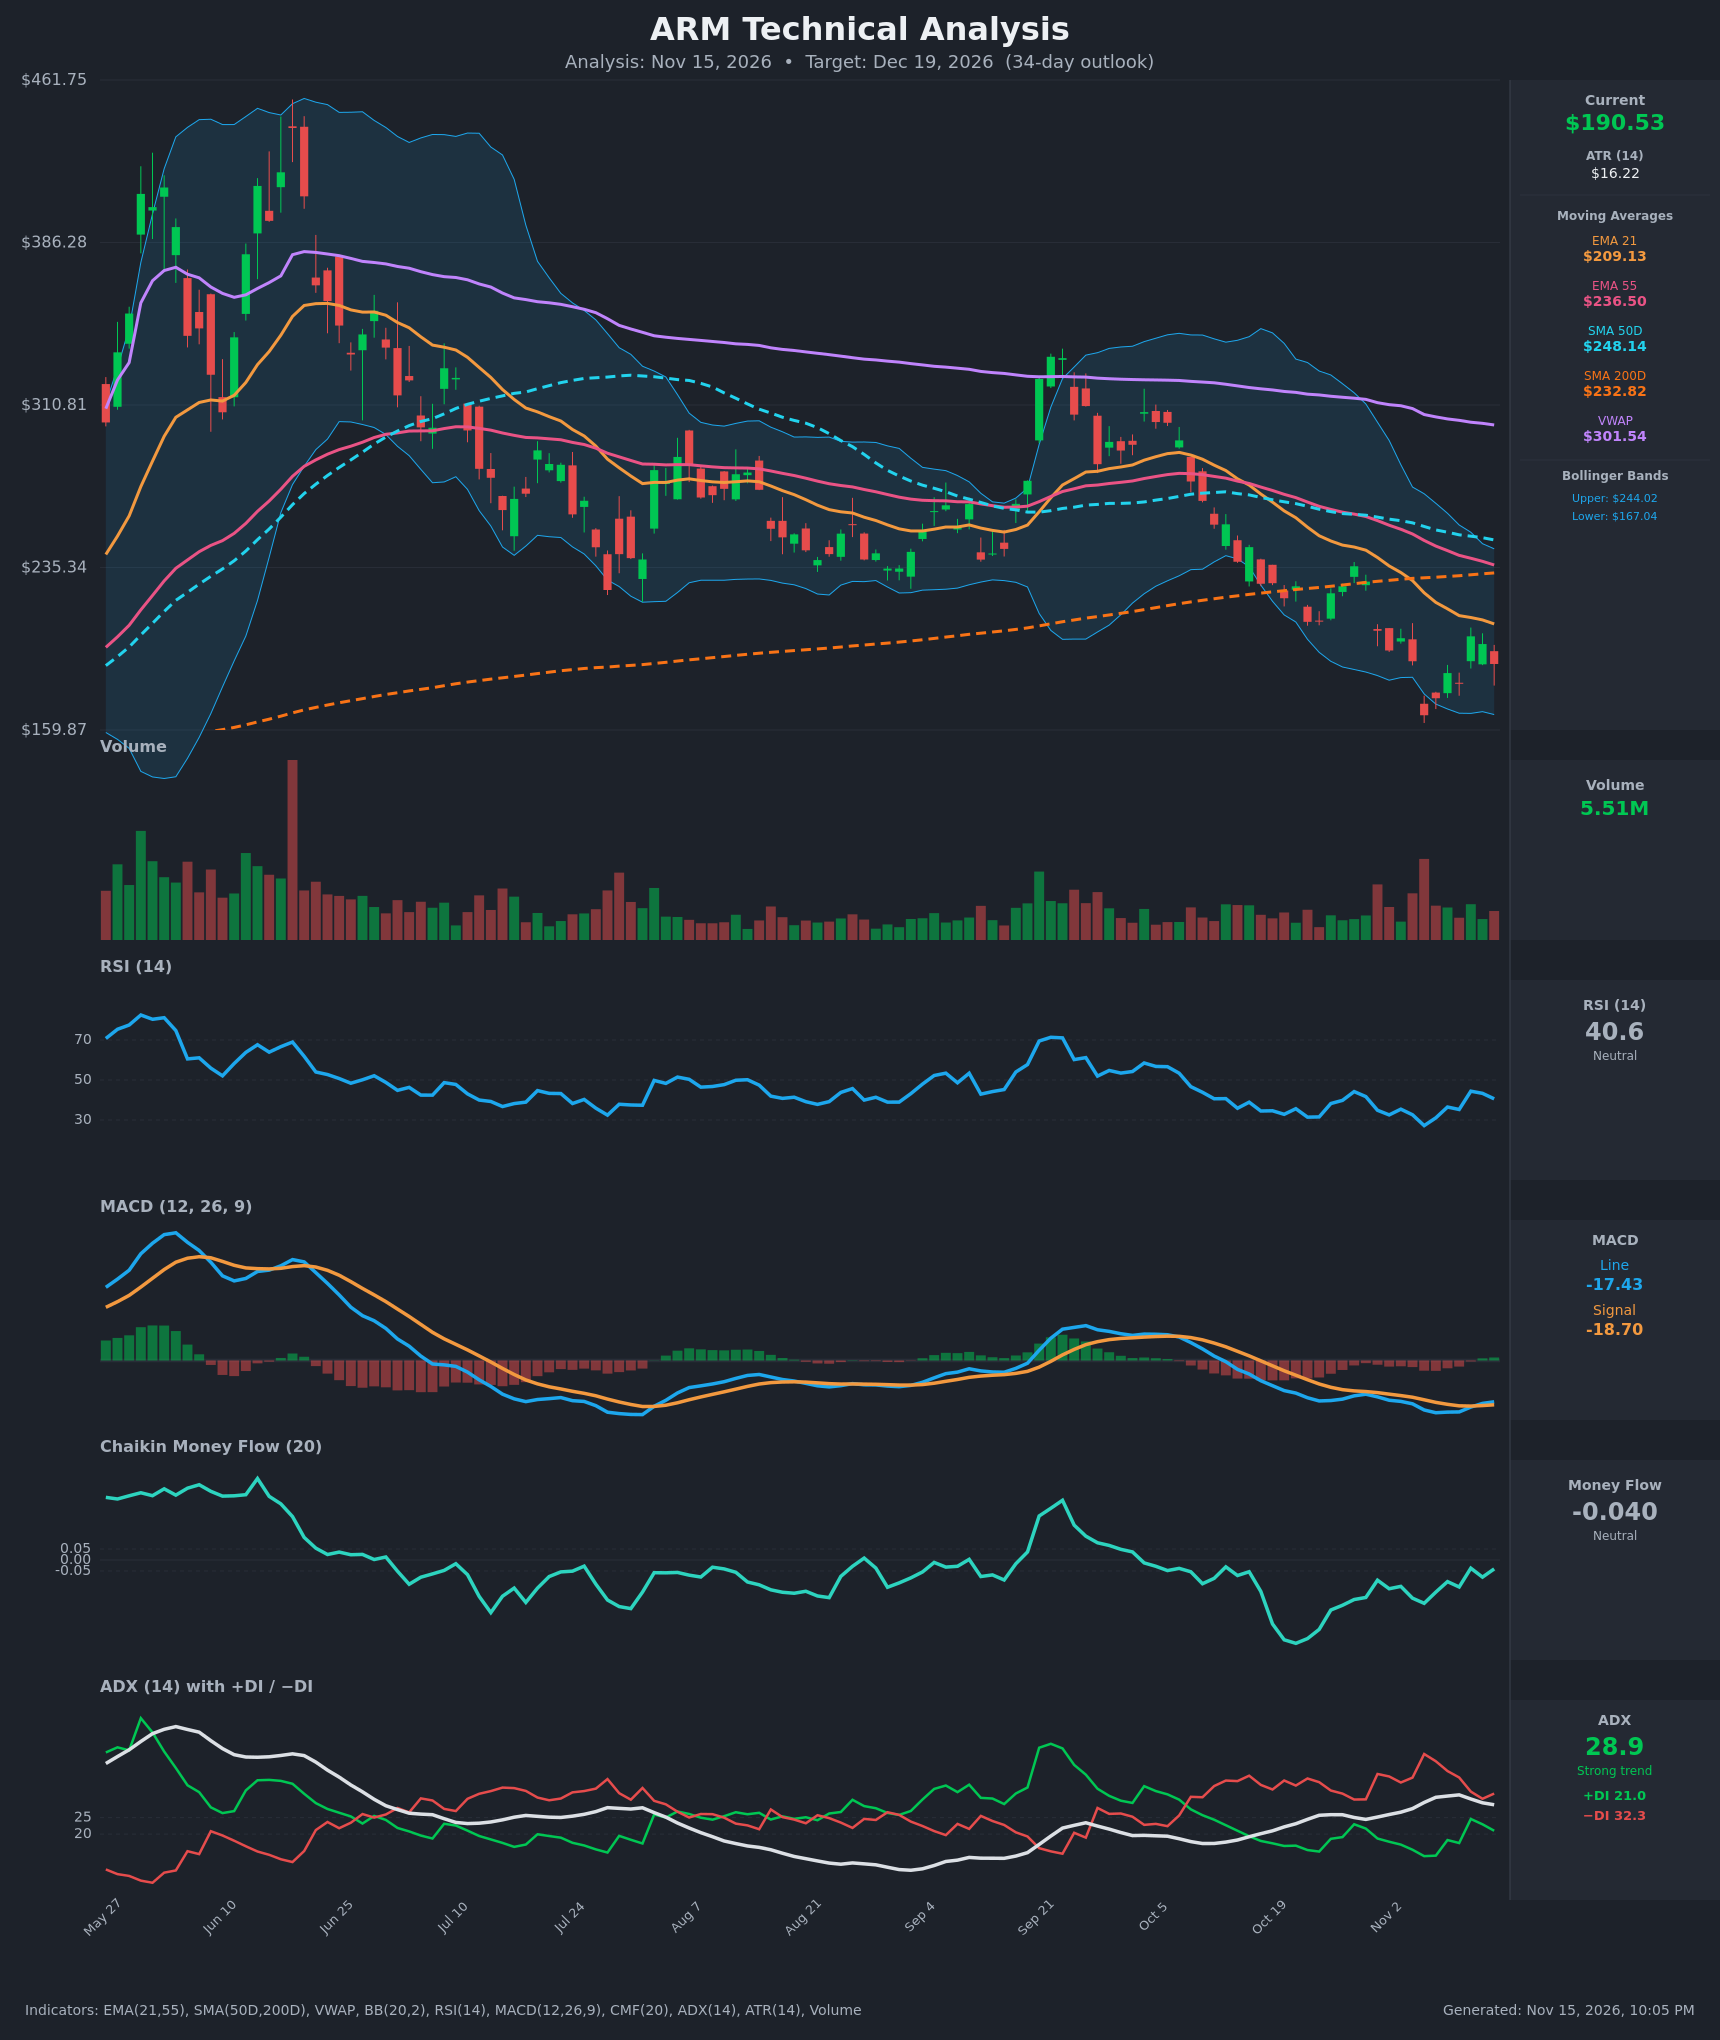
- RSI (14): 40.58, below the 50 midline but recovering from an oversold low of 27.2 on Nov 5. It has bounced and then stalled in the 35-44 zone, which looks like a weak relief bounce rather than a strong reversal. [Bearish]
- 20 EMA: The 21 EMA is $209.13, about 9% above price at $190.53. It is falling steeply (from $247.65 on Oct 26) and acts as overhead resistance. The 55 EMA ($236.50) and SMA50D ($248.14) sit well above it. [Bearish]
- MACD: Line at -17.43 versus signal at -18.70. The line crossed back above the signal on Nov 12 (-18.11 vs -19.02), so the histogram has turned slightly positive. This is a minor bullish crossover deep in negative territory, and it has not confirmed a trend change. [Neutral]
- Bollinger Bands (20): Upper $244.02, lower $167.04, mid about $205.5. Price is in the lower half of the bands, below the midline. It bounced off the lower band on Nov 5 ($166.72) and was rejected near the midline on Nov 11. The bands are wide, so volatility is elevated. [Bearish]
- CMF (20): -0.040, in the neutral band (between -0.05 and +0.05). It improved from -0.227 on Oct 26, so selling pressure is easing, but there is no accumulation yet. [Neutral]
- ADX (14): 28.9 with −DI (32.3) above +DI (21.0). The trend is strong and bearish, though ADX is slowly rolling over from its 31.9 peak. [Strong Trend – Bearish]
- Volume: 5.51M, light. The recent bounce came on modest volume, while the heavy-volume bars were on down days, such as the Nov 5 capitulation. Weak bounce participation is not a sign of accumulation. [Bearish/Weak Bounce]
DIVERGENCES & TRENDS
- Price made a lower low on Nov 5 ($166.72) with RSI at 27.2. The current price of $190.53 is above that low while RSI is only 40.6, so there is no clear divergence. The RSI low of 27.2 was the lowest in the visible window.
- The MACD line is flattening and has crossed above the signal. This is a small momentum improvement, but it remains far below zero.
- CMF has moved from -0.227 to -0.040, which is a mild improvement in money flow. It has not turned positive.
- All moving averages are stacked bearishly. Price is below the EMA21, EMA55, SMA50D and SMA200D, and well below VWAP ($301.54).
- The SMA50D ($248.14) is still above the SMA200D ($232.82), so there is no death cross yet, but the gap is narrowing quickly (about $15 and closing). A death cross is likely within the 34-day window.
- Price lost the SMA200D in late October, which is a major long-term trend break.
CHART PATTERNS
- Bearish Rising Wedge / Flag-like action: The sequence of lower highs since the September peak ($330+) with lower lows resembles a descending channel. It has been broken to the downside, and the Nov 5 flush to $166.72 was the leg lower.
- Possible Bullish Falling Wedge (low-probability): The last few weeks of compressing lower highs and lows could form a falling wedge. It would need a breakout above the EMA21 (about $209) to confirm, which has not happened.
- The overall structure is a bearish continuation. The failed bounce at the 21 EMA and the declining SMA200D reclaim attempts point to lower prices. The measured move from the Oct drop suggests a retest of the $167 low, and possibly a break toward $150.
- Support is the Nov 5 low and the lower Bollinger Band at $167-$167.04. Resistance is the EMA21 at $209 and then the SMA200D at $232.82.
POTENTIAL SCENARIOS
- Scenario 1: Bearish Continuation / Retest of Lows — Price fails at the declining EMA21 and −DI stays on top, so the stock retests and possibly breaks the Nov 5 low. Trigger: rejection below $200-$209 or a close below $175. Target: $165-$170, with an extension to about $150-$155. Invalidation: daily close above $209 (EMA21). (50% probability)
- Scenario 2: Neutral Base Building — Price chops between $167 and $210 as the MACD stays flat and CMF hovers near zero. Trigger: holds above $170 with no break of $209. Target: $185-$200. Invalidation: close outside $165-$212. (25% probability)
- Scenario 3: Bullish Relief Rally — The MACD crossover and easing CMF carry price to the EMA21 and the mid-band, possibly the SMA200D. Trigger: close above $209 on rising volume. Target: $225-$235 (EMA55 and SMA200D). Invalidation: close back below $180. (25% probability)
PRICE TARGETS
For a 34-day timeframe the range width should be ~12-18% of the current price (about $23-$34). Here I use about $40 (21%) because ATR is high ($16.22, 8.5% of price), which justifies the wider end.
- Target Price: $180.00 (34-day)
- Expected Range: $158.00 to $204.00 (width $46, about 24% of price; widened because of elevated ATR and volatility)
- Key Levels: Support at $167.04, Resistance at $209.13
OVERALL BIAS
OVERALL BIAS: BEARISH - Price is below all key moving averages with −DI dominating and ADX at 28.9. The bounce is weak, with light volume and rejection near the EMA21, so a retest of the $167 low is more likely than a sustained recovery. The slight MACD crossover and improving CMF limit conviction, which is why the target is only modestly below the current price.
This is educational analysis and not financial advice.