ARM 20-day bearish forecast — Nov 15, 2026
- Bias: Bearish
- Timeframe: 20 days (made Nov 15, 2026, target date Dec 4, 2026)
- Price at analysis: $190.53
- Price target: $182.00
- Expected range: $168.00 – $204.00
- Result: Pending — graded after the close on Dec 4, 2026
Get a free AI analysis of ARM today
Analysis
TECHNICAL INDICATORS
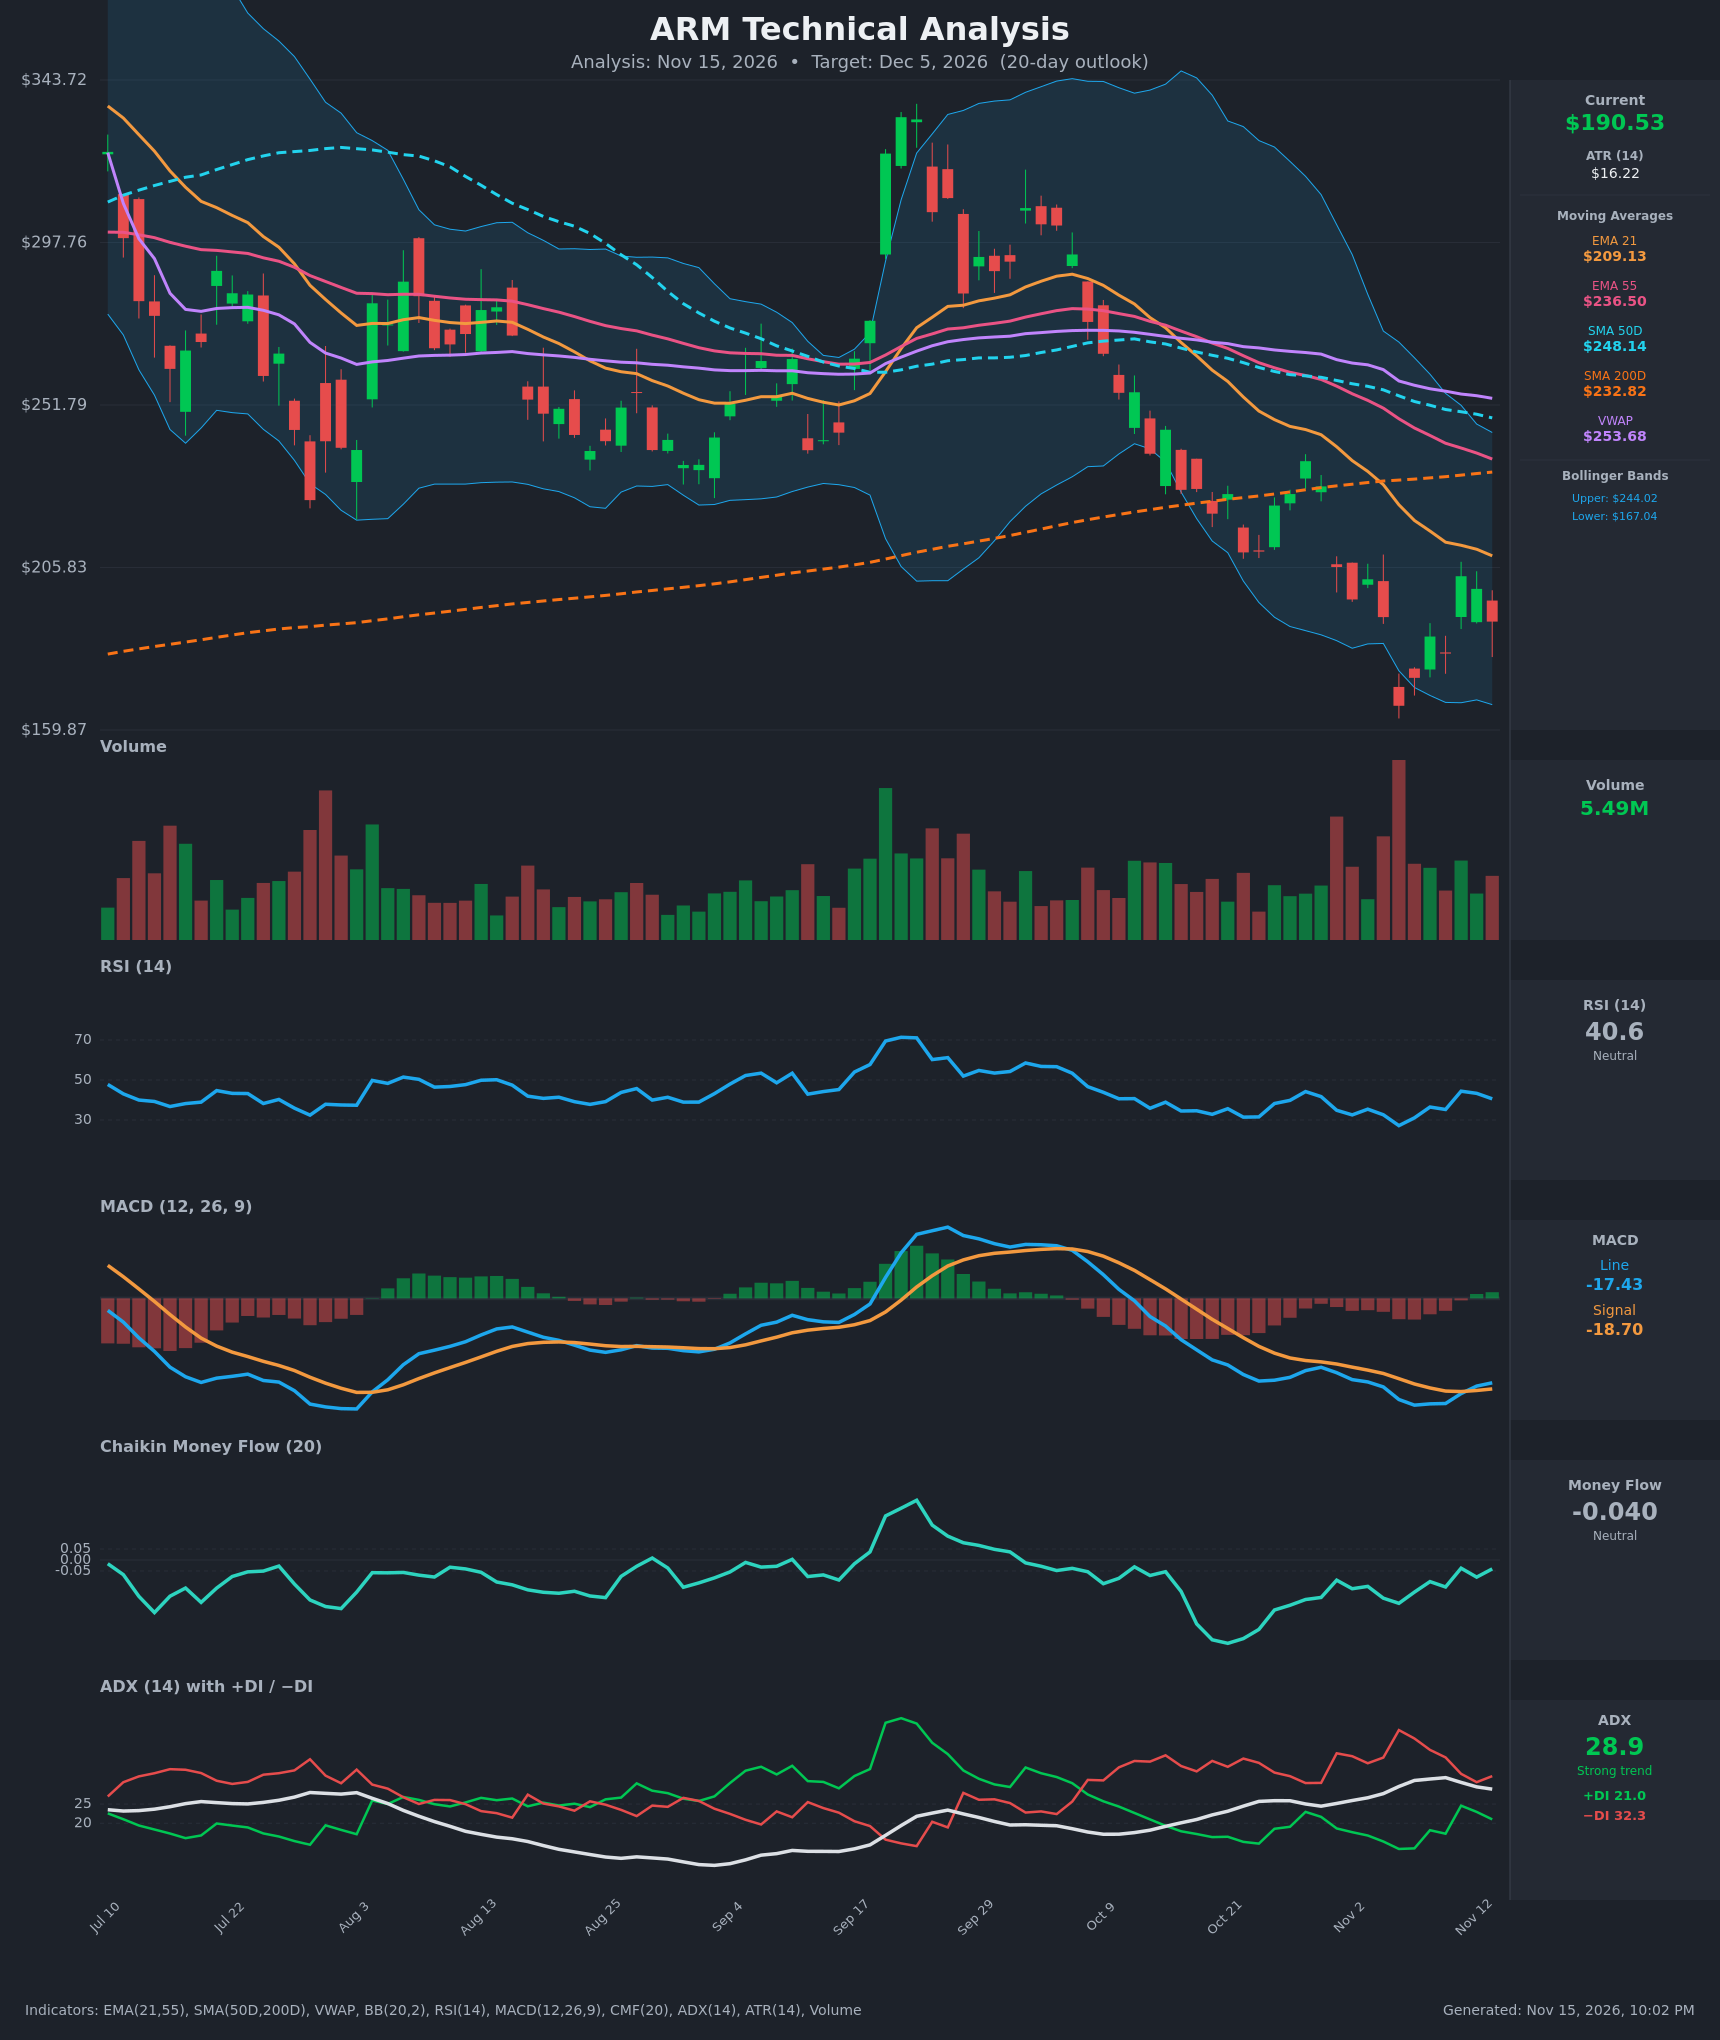
- RSI (14): 40.58, recovering from an oversold low of 27.2 on Nov 5 but still below 50 and rolling over from 44.4 on Nov 11. Momentum is weak, with a small bounce fading. [Bearish]
- 20 EMA: The nearest tracked value is the EMA 21 at $209.13, with price at $190.53 about 9% below it. The EMA is falling steeply, and the EMA 21 is well below the EMA 55 ($236.50), so it acts as overhead resistance. [Bearish]
- MACD: Line -17.43 is above signal -18.70 after a tiny bullish crossover on Nov 12, and the histogram is barely positive (+1.27). Both lines sit deep in negative territory, so this is only an early, tentative momentum stabilization rather than a trend reversal. [Neutral]
- Bollinger Bands (20): Upper $244.02, lower $167.04, midline about $205.5. Price is in the lower half, 31% of the way up the band, after touching the lower band on Nov 5 ($166.72). The bands are wide, which reflects high volatility, and price is below the midline, so the trend remains down. [Bearish]
- CMF (20): -0.040 is within the neutral zone and has improved from -0.227 on Oct 26. Selling pressure is easing, but there is no accumulation yet. [Neutral]
- ADX (14): 28.9 with -DI (32.3) above +DI (21.0). That is a strong downtrend, though ADX is slightly off its peak of 31.9 and +DI is recovering from 13.3. [Strong Trend – Bearish]
- Volume: 5.49M on the latest bar, moderate and below the spikes seen on the Nov 5 capitulation selloff. The bounce attempts lacked conviction, and red bars dominate recent heavy-volume sessions. [Bearish-leaning, no clear accumulation]
DIVERGENCES & TRENDS
- Price made a lower low on Nov 5 ($166.72) with RSI at 27.2, and price is now at $190.53, well above that low. The RSI low of 27.2 was deeper than the earlier trough around 31–32 in late July and early August, so there is no clean bullish divergence.
- MACD made a slightly higher low (-22.05) against price's lower low, a mild bullish momentum improvement, but it is not confirmed.
- Trend structure is bearish. Price is below the EMA 21, EMA 55, SMA 50D ($248.14) and VWAP ($253.68). It has also lost the SMA 200D ($232.82), which is now overhead resistance.
- The SMA 50D remains above the SMA 200D, but the gap is narrowing quickly. A death cross is a risk over the next few weeks if weakness persists.
- The EMA 21 crossed below the EMA 55 well before this window, a confirmed bearish alignment.
- -DI remains dominant over +DI, with no DI crossover.
- Price has repeatedly failed to hold bounces: the Nov 11 rally to $203 reversed within two sessions.
CHART PATTERNS
- Bearish continuation / lower-highs sequence: Price has stair-stepped lower since the late-September peak, with rejections at the declining EMA 21. This resembles a Bearish Flag/Pennant forming after the sharp drop to $166.72. The sharp drop is the flagpole, and the current bounce between about $167 and $205 is the consolidation.
- Possible Bullish Double Bottom: The Nov 5 low (~$167) and the Nov 13 test of the ~$186–190 area are not equal lows, so this pattern is not confirmed and would require a close above the ~$203 swing high.
- Targets: A flag breakdown below ~$180 projects a measured move toward $150–160. The bullish alternative is a bounce to the $205–209 EMA 21 and then the $232 SMA 200D.
POTENTIAL SCENARIOS
- Scenario 1: Bearish Flag Breakdown — The bounce fails at the falling EMA 21, and sellers push price back toward and below the Nov 5 low as -DI stays dominant. Trigger: close below $180 with rising volume. Target: $165–$172, with an extension to ~$155. Invalidation: daily close above $209 (EMA 21). (50% probability)
- Scenario 2: Neutral Range Consolidation — Price chops between the lower Bollinger Band area (~$167–$175) and the $203–$209 resistance as MACD flattens and RSI hovers 35–48. Trigger: holds above $175 without closing above $205. Target: $180–$200. Invalidation: close outside $170–$210. (22% probability)
- Scenario 3: Bullish Relief Rally — The MACD crossover and easing CMF drive an oversold bounce toward the EMA 21 and the SMA 200D. Trigger: close above $203–$209 with volume. Target: $220–$233. Invalidation: close back below $180. (28% probability)
PRICE TARGETS
For the 20-day timeframe (14–21 day guidance of ~8–12% width; 20 days sits at the upper end, so ~$21 width ≈ 11–12% using ATR scaling for volatility):
- Target Price: $182.00
- Expected Range: $168.00 to $204.00 (width $36 ≈ 18.9%, wider than guidance because ATR is high at $16.22 (8.5% of price) and a 20-day window adds volatility; the ~11% guidance would be too tight for this stock)
- Key Levels: Support at $166.72, Resistance at $209.13
OVERALL BIAS
OVERALL BIAS: BEARISH - Price is below all major moving averages, including the SMA 200D, with -DI (32.3) well above +DI (21.0) and ADX at 28.9 confirming a strong downtrend. The tiny MACD crossover and neutral CMF are only tentative stabilization, and rallies keep failing at the falling EMA 21.
This is educational analysis and not financial advice.