ARM 48-day bearish forecast — Nov 15, 2026
- Bias: Bearish
- Timeframe: 48 days (made Nov 15, 2026, target date Jan 1, 2027)
- Price at analysis: $190.53
- Price target: $179.00
- Expected range: $163.00 – $196.00
- Result: Pending — graded after the close on Jan 1, 2027
Get a free AI analysis of ARM today
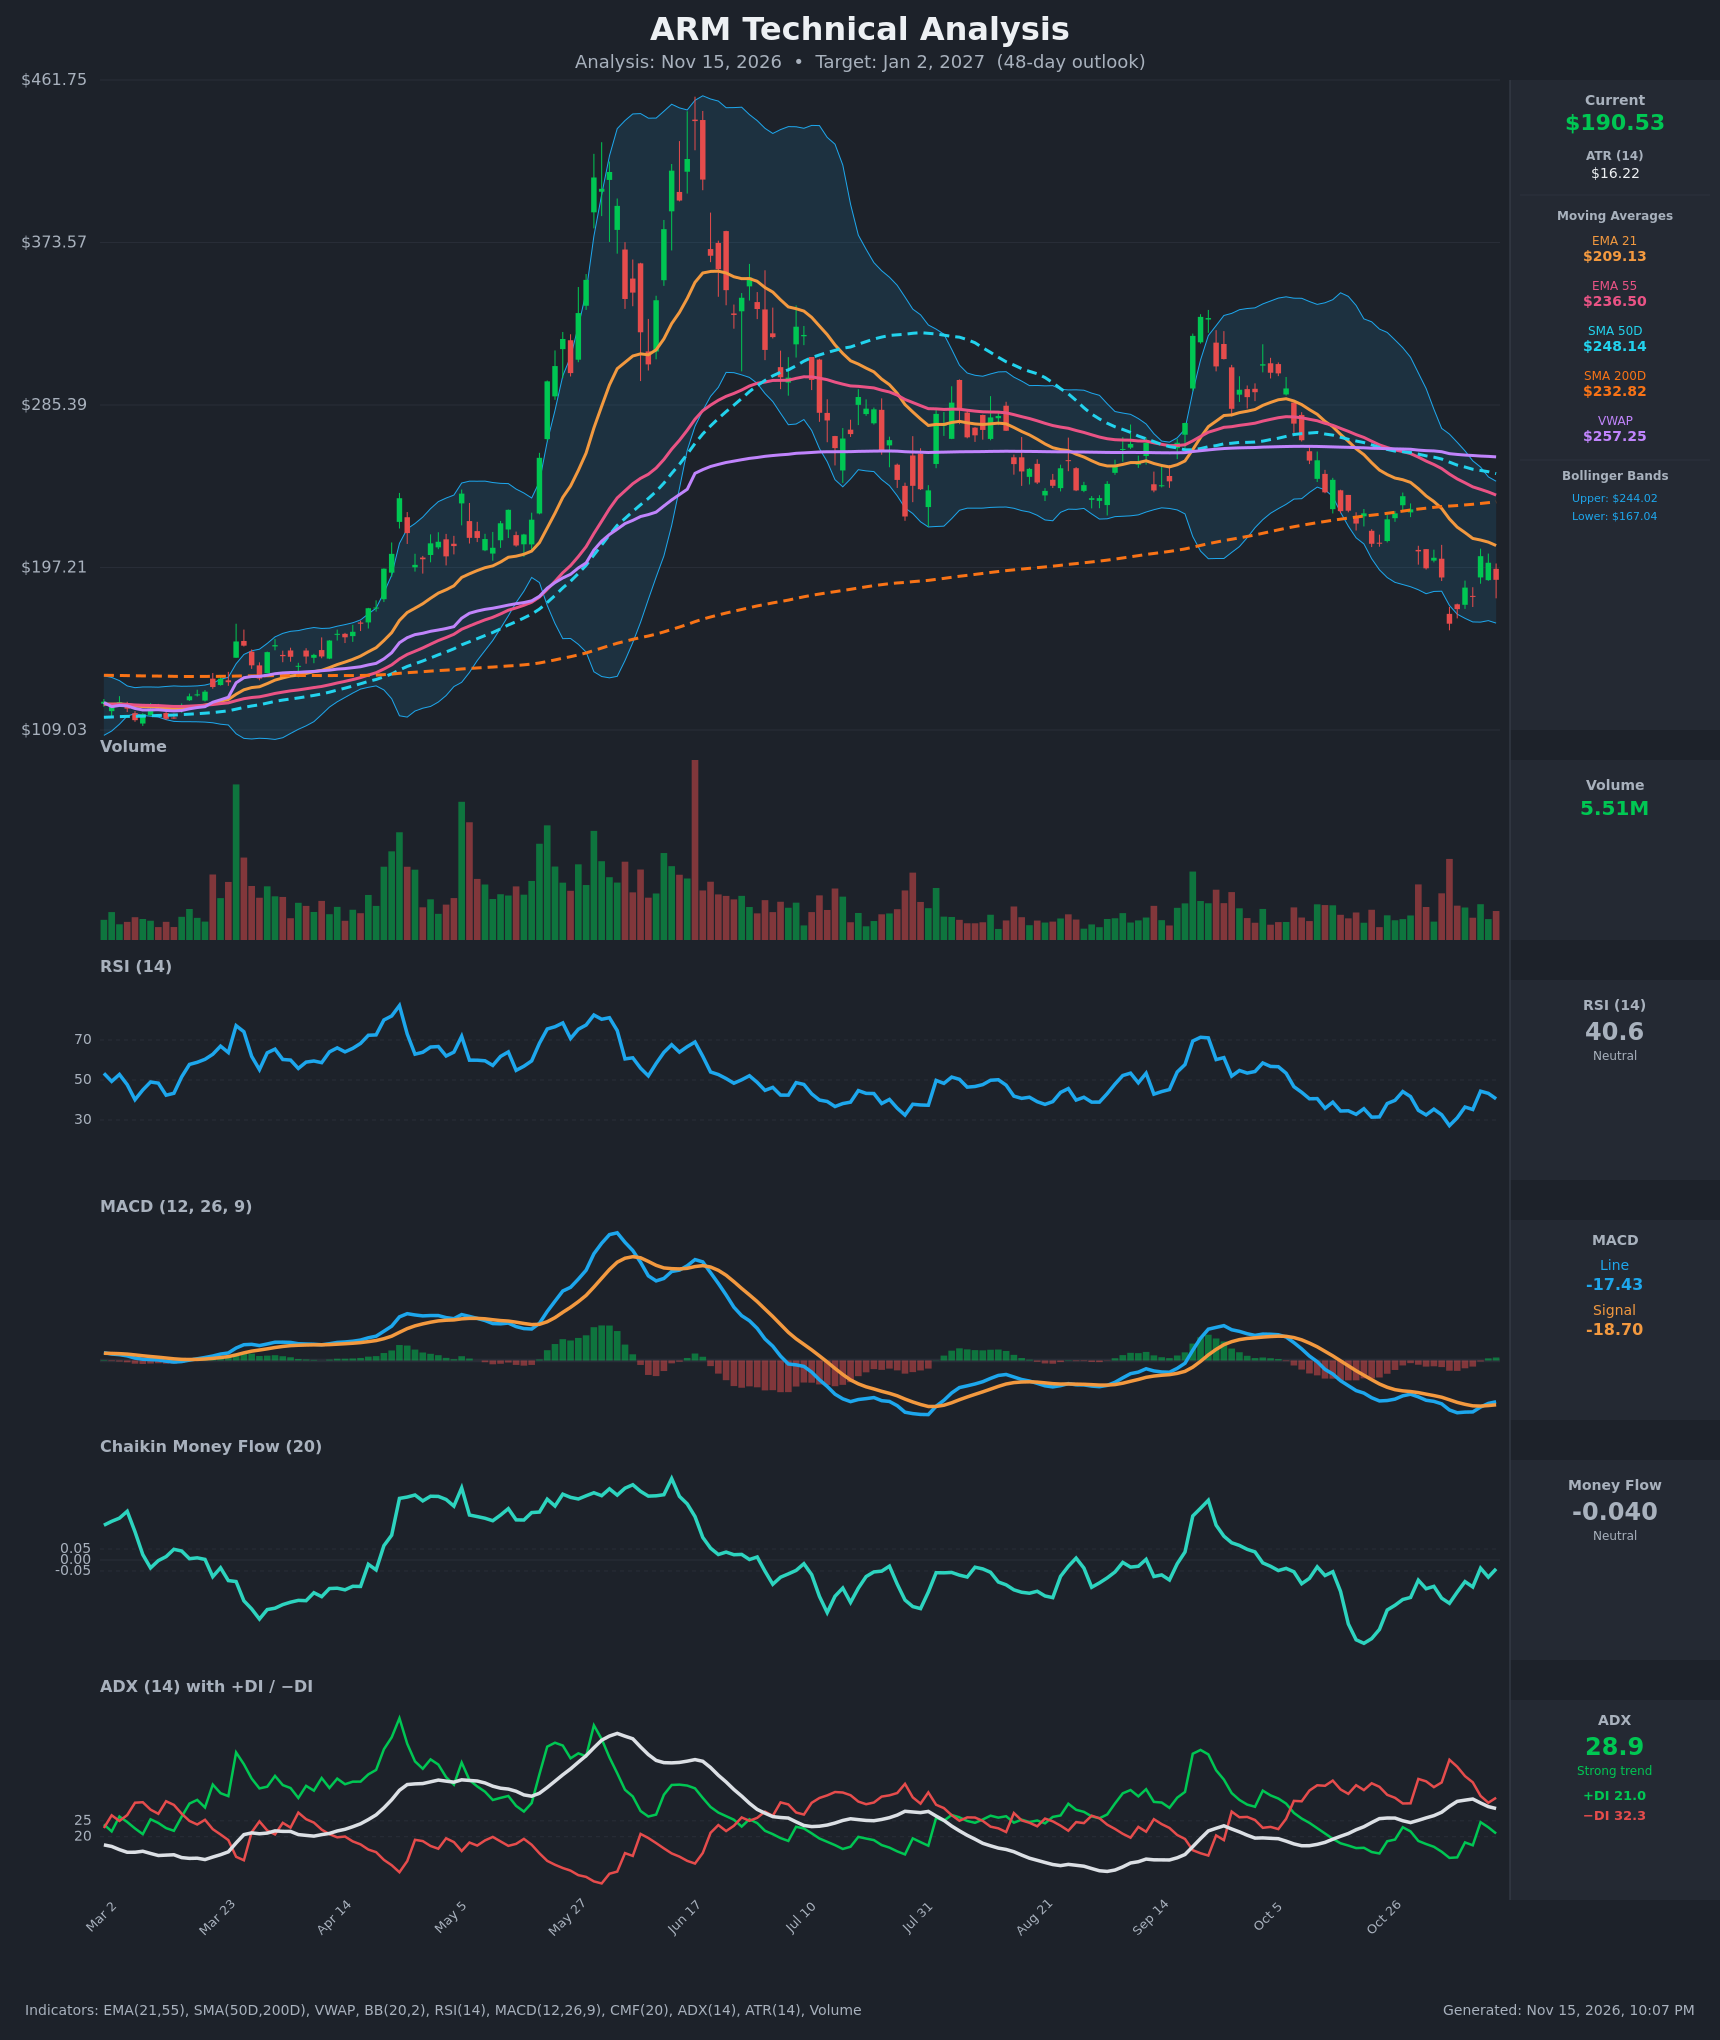
Analysis
TECHNICAL INDICATORS
- RSI (14): 40.58, up from the 27.2 oversold low on Nov 5. It has bounced but is failing below 50, which in a downtrend is typically a resistance zone. Momentum is recovering slightly but remains weak. [Bearish]
- 20 EMA: The 21 EMA is $209.13 and the 55 EMA is $236.50. Price at $190.53 is below both, and both are sloping down. The 21 EMA is overhead resistance, about 9.8% above price. [Bearish]
- MACD: The line is -17.43 and the signal is -18.70, so the histogram is slightly positive. The line crossed above the signal on Nov 11. The cross happened deep below zero, which makes it a weak relief signal inside a larger downtrend. [Neutral]
- Bollinger Bands (20): The upper band is $244.02 and the lower is $167.04, so the midline is about $205.5. Price is in the lower half of the bands, having tagged the lower band on Nov 5 ($166.72). It sits below the midline, which is the typical zone for a downtrend "walk," with a rebound target near $205. [Bearish]
- CMF (20): -0.040 sits inside the ±0.05 neutral band. It has improved from -0.227 on Oct 26 but has been negative for weeks, so there is no accumulation to support a sustained rally. [Neutral]
- ADX (14): 28.9 is above 25, a strong trend, though it has eased from 31.9. -DI at 32.3 is well above +DI at 21.0, so bears control. +DI briefly rose to 24.6 on Nov 11 and then rolled over. [Strong Trend – Bearish]
- Volume: 5.51M is modest next to the capitulation-style volume on the Nov 5 breakdown. The rebound attempts have come on unremarkable volume, which shows weak buying conviction. Price is also below VWAP ($257.25), which signals persistent selling pressure. [Mildly Bearish]
DIVERGENCES & TRENDS
- Moving averages: The 21 EMA crossed below the 55 EMA earlier, and the 21/55 gap keeps widening. The 50D SMA ($248.14) is falling toward the 200D SMA ($232.82). Their gap is only about $15, so a death cross is likely within the 48-day window. Price is already below the 200D SMA, which confirms a long-term downtrend break.
- RSI: The RSI low of 27.2 on Nov 5 coincided with the price low of $166.72. There is no clear bullish divergence, only an oversold bounce.
- MACD: The recent bullish line/signal cross is a minor counter-trend signal. The MACD line remains deeply negative, at levels last seen during the July–August decline.
- Lower highs: Price has made a clear sequence of lower highs ($330s → ~$280s → ~$235 → ~$203) and a lower low at $166.72.
- VWAP: Price is far below VWAP, which has been flat around $257. That level is a distant overhead magnet and resistance.
CHART PATTERNS
- Downtrend with lower highs and lower lows: This is the dominant structure. The decline from the ~$440 peak through the 200D SMA breakdown resembles a large Bearish Head and Shoulders-type topping process. The neckline break near the 200D SMA (~$230) points to a measured move toward the $160s–$170s, where price is currently trading.
- Possible Bearish Flag / Pennant: The bounce from $166.72 to ~$203 and the subsequent pullback could form a small bearish flag. A break below ~$181 would project toward $155–$160.
- Possible Bullish Double Bottom: The $166.72 low is a candidate first bottom. It needs a second test that holds, followed by a close above ~$203–$209, to confirm. That has not happened yet.
POTENTIAL SCENARIOS
- Scenario 1: Bearish Trend Continuation — Price stays below the falling 21 EMA, the 50D/200D death cross forms, and sellers retest the November lows. Trigger: a daily close below $181.49, then below $166.72. Target: $165–$175, with an extension to ~$155 if $166.72 breaks. Invalidation: a daily close above $209 (21 EMA). (50% probability)
- Scenario 2: Bullish Relief Rally — An oversold bounce, helped by the MACD cross and RSI recovery, carries price to the Bollinger midline and the 21 EMA. Trigger: a close above $203.36 on rising volume. Target: $205–$220. Invalidation: a close back below $181. (30% probability)
- Scenario 3: Neutral Range Consolidation — Price chops between the $167 lower band and the ~$205 midline as ADX fades. Trigger: repeated holds above $175 and rejections below $205. Target: $180–$200. Invalidation: a close outside $166–$210. (20% probability)
PRICE TARGETS
- Target Price: $179.00 (Jan 2, 2027, 48 days out)
- Expected Range: $163.00 to $196.00 (width $33, about 17.3% of current price, consistent with the 30–60 day guidance)
- Key Levels: Support at $166.72, Resistance at $209.13
OVERALL BIAS
OVERALL BIAS: BEARISH - Price is below every major moving average and VWAP, −DI dominates with ADX near 29, and a 50D/200D death cross is approaching. The MACD cross and the bounce from oversold RSI are only weak counter-trend relief, which makes lower highs likely and a retest of the $166 area probable.
This is educational analysis and not financial advice.