ARM 83-day bearish forecast — Nov 15, 2026
- Bias: Bearish
- Timeframe: 83 days (made Nov 15, 2026, target date Feb 5, 2027)
- Price at analysis: $190.53
- Price target: $176.00
- Expected range: $154.00 – $200.00
- Result: Pending — graded after the close on Feb 5, 2027
Get a free AI analysis of ARM today
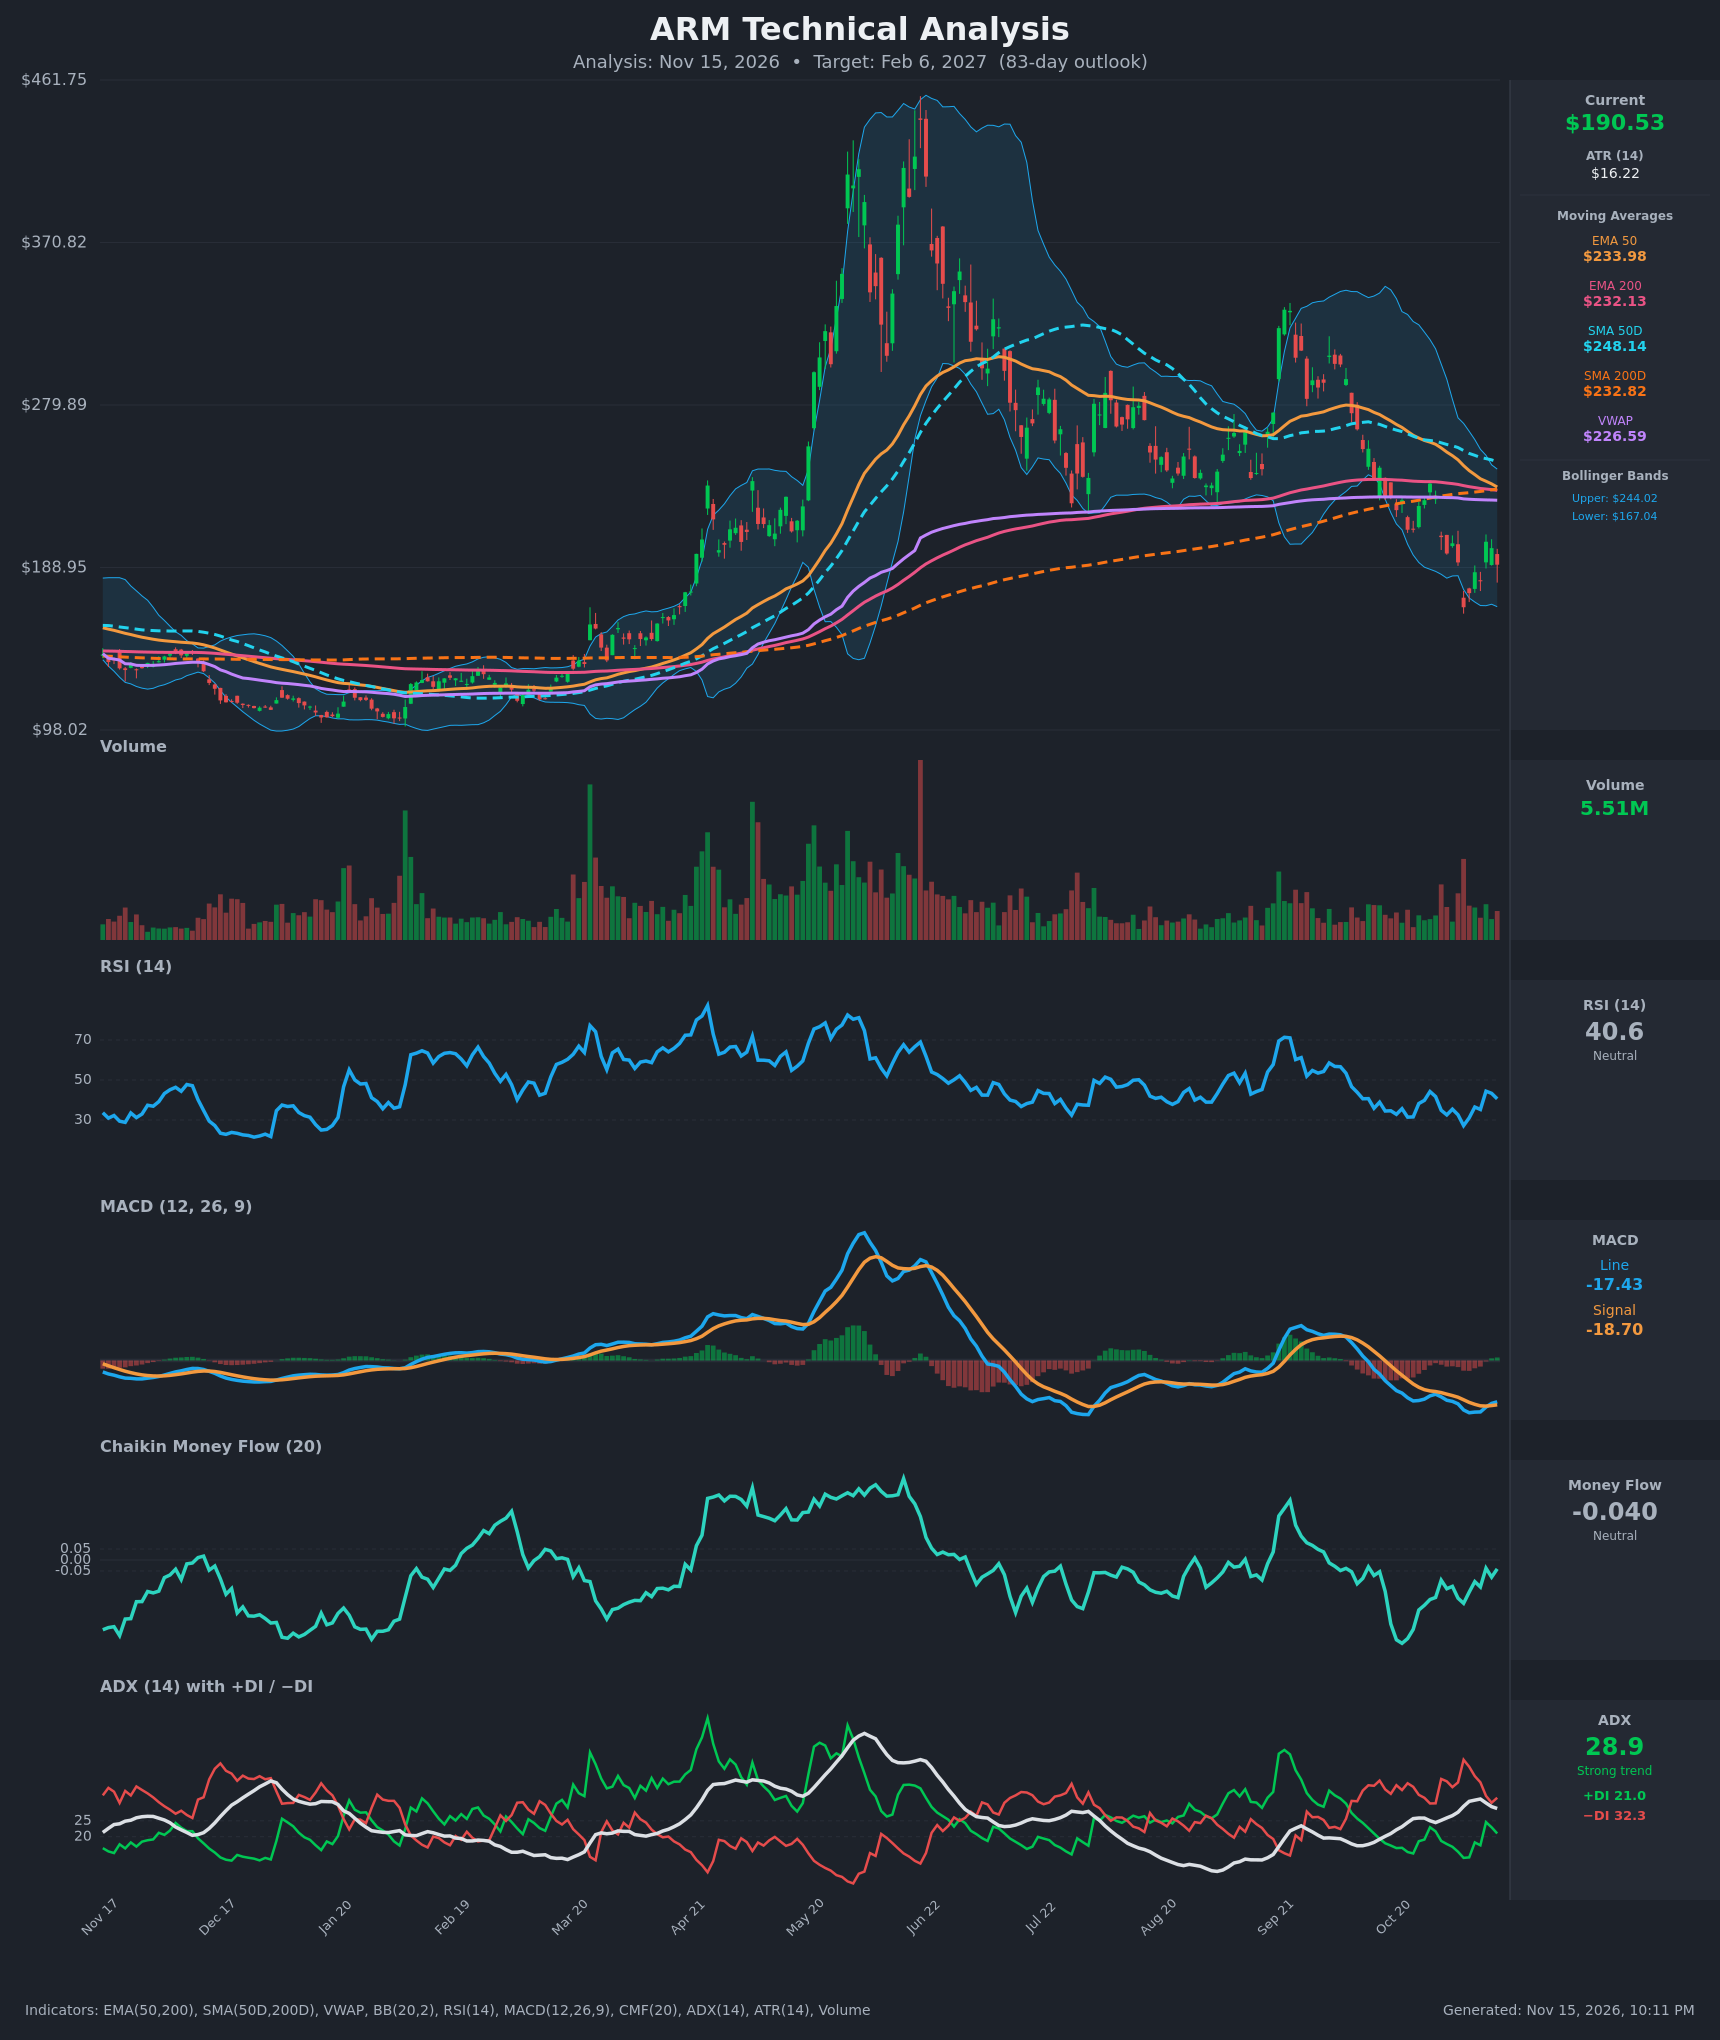
Analysis
TECHNICAL INDICATORS
- RSI (14): 40.58, below the 50 midline and well off the 27.2 oversold low on Nov 5. It bounced to 44.4 on Nov 11 and has rolled over to 40.6 (lower high). Momentum is weak but not oversold. [Bearish]
- 20 EMA: The 20 EMA was not supplied, so I use the longer EMAs. Price ($190.53) sits about 18% below EMA 50 ($233.98) and about 18% below EMA 200 ($232.13), and below VWAP ($226.59). EMA 50 is falling steeply and is about to cross below EMA 200, a bearish cross. All of these overhead averages act as resistance. [Bearish]
- MACD: Line -17.43 vs signal -18.70, histogram slightly positive (+1.27). A minor bullish crossover occurred around Nov 12, but both lines are deeply negative and below zero. This is a weak relief signal inside a downtrend, not a trend change. [Neutral]
- Bollinger Bands (20): Upper $244.02, lower $167.04, midline about $205.53. Price is in the lower half (%B ≈ 0.31). The bands are wide and sloping down after the Nov 5 tag of the lower band ($166.72 close). Price failed to reclaim the midline on the bounce. [Bearish]
- CMF (20): -0.040, inside the neutral band (±0.05) but negative. It has improved from -0.227 on Oct 26, so selling pressure is easing, but there is no real accumulation yet. [Neutral]
- ADX (14): 28.9 with −DI 32.3 above +DI 21.0. ADX is above 25, so the trend is strong, and the −DI dominance puts the bears in control. ADX is easing from the 31.9 peak and +DI is recovering, so selling pressure is fading slightly. [Strong Trend – Bearish]
- Volume: 5.51M, around average. The heaviest volume came on the red selloff days (Oct 30 to Nov 5), while the bounces have come on lighter volume. That suggests the rebound is corrective rather than a demand-led reversal. [Mildly Bearish]
DIVERGENCES & TRENDS
- Divergences: There is no clean bullish divergence. RSI printed 27.2 at the Nov 5 low (close $166.72), and the later pullback to $181 held RSI around 35, a modest improvement but not a true divergence. The later close of $190.53 with RSI 40.6 is a lower high in RSI versus 44.4 on Nov 11.
- Moving averages: Price is below the SMA200D ($232.82), so the long-term trend is down. SMA50D ($248.14) is still above SMA200D, but the gap has narrowed from about $35 to about $15 in two weeks, so a death cross is likely within the next 4 to 8 weeks. EMA 50 vs EMA 200 is only about $1.85 apart and about to cross bearishly.
- Trend structure: The chart shows lower highs (about $455 in June, about $330 in September, about $236 in late October) and a break below the September–October base (about $220). The trend is clearly down on the daily chart.
- MACD: It crossed up around Nov 12 but remains deeply negative. Watch for rejection near zero or a roll-over toward the signal line.
- ADX/DI: −DI has been above +DI for most of the past three weeks, and a +DI/−DI cross has not happened.
CHART PATTERNS
- Bearish Head and Shoulders / lower-high distribution (large scale): The June peak (head) and September peak (right shoulder) with a broken neckline around $215–225 resemble a bearish head and shoulders. A full measured move would be unrealistically large because the stock started at about $100, so I treat it as a bias signal and not a target. The more relevant support is the Nov 5 low near $167 and, below that, the $120–$130 base from earlier in the year.
- Bearish Pennant / Flag (short term): The small bounce from $166.72 to $203 and the pullback to $190 are a corrective counter-trend move. A failure to hold the $181–$186 area opens a retest of $167.
- Possible Bullish Double Bottom (lower probability): A higher low near $181 (Nov 10) against $166.72 is only an early, unconfirmed double-bottom attempt. It would be confirmed above about $203–$205, which is also the Bollinger midline.
POTENTIAL SCENARIOS
- Scenario 1: Bearish Continuation Lower — The relief bounce fails below the $203–$205 resistance and below the Bollinger midline. The EMA 50/EMA 200 and SMA 50/SMA 200 bearish crosses add pressure while −DI stays above +DI. Trigger: a close below $181 (Nov 10 low). Target: $167 retest, with an extension to about $155. Invalidation: a daily close above $205 with CMF above +0.05. (50% probability)
- Scenario 2: Bullish Base and Mean-Reversion Rally — Price holds above $167, RSI stays above 40, and the MACD crossover plus improving CMF drive a recovery toward the falling moving averages. Trigger: a close above $203.36 on rising volume. Target: $225 to $235 (VWAP/EMA 200 cluster). Invalidation: a close below $166.72. (30% probability)
- Scenario 3: Neutral Range-Bound Chop — Price oscillates between about $167 and $205 as selling exhausts and buyers remain cautious. Trigger: repeated failures at both ends of the range. Target: $185 to $195. Invalidation: a close outside $165–$207. (20% probability)
PRICE TARGETS
- Target Price: $176.00 (83-day, about -7.6% from $190.53)
- Expected Range: $154.00 to $200.00 (width $46, about 24% of current price, consistent with the 61–180 day guidance of 18–30%)
- Key Levels: Support at $166.72, Resistance at $203.36
OVERALL BIAS
OVERALL BIAS: BEARISH - Price is below every major moving average, with −DI (32.3) above +DI (21.0) and ADX at 28.9 showing a strong downtrend. EMA 50/200 and SMA 50/200 are converging toward bearish crosses, and the lower-high structure and weak-volume bounces favor a retest of the $167 low. The minor MACD crossover and improving CMF keep conviction modest.
This is educational analysis and not financial advice.