EEM 4-day bearish forecast — Nov 1, 2026
- Bias: Bearish
- Timeframe: 4 days (made Nov 1, 2026, target date Nov 4, 2026)
- Price at analysis: $61.03
- Price target: $60.55
- Expected range: $59.30 – $61.80
- Result: Incorrect (+1.0%) — closed at $61.62 on Nov 4, 2026; quality score 50/100
Get a free AI analysis of EEM today
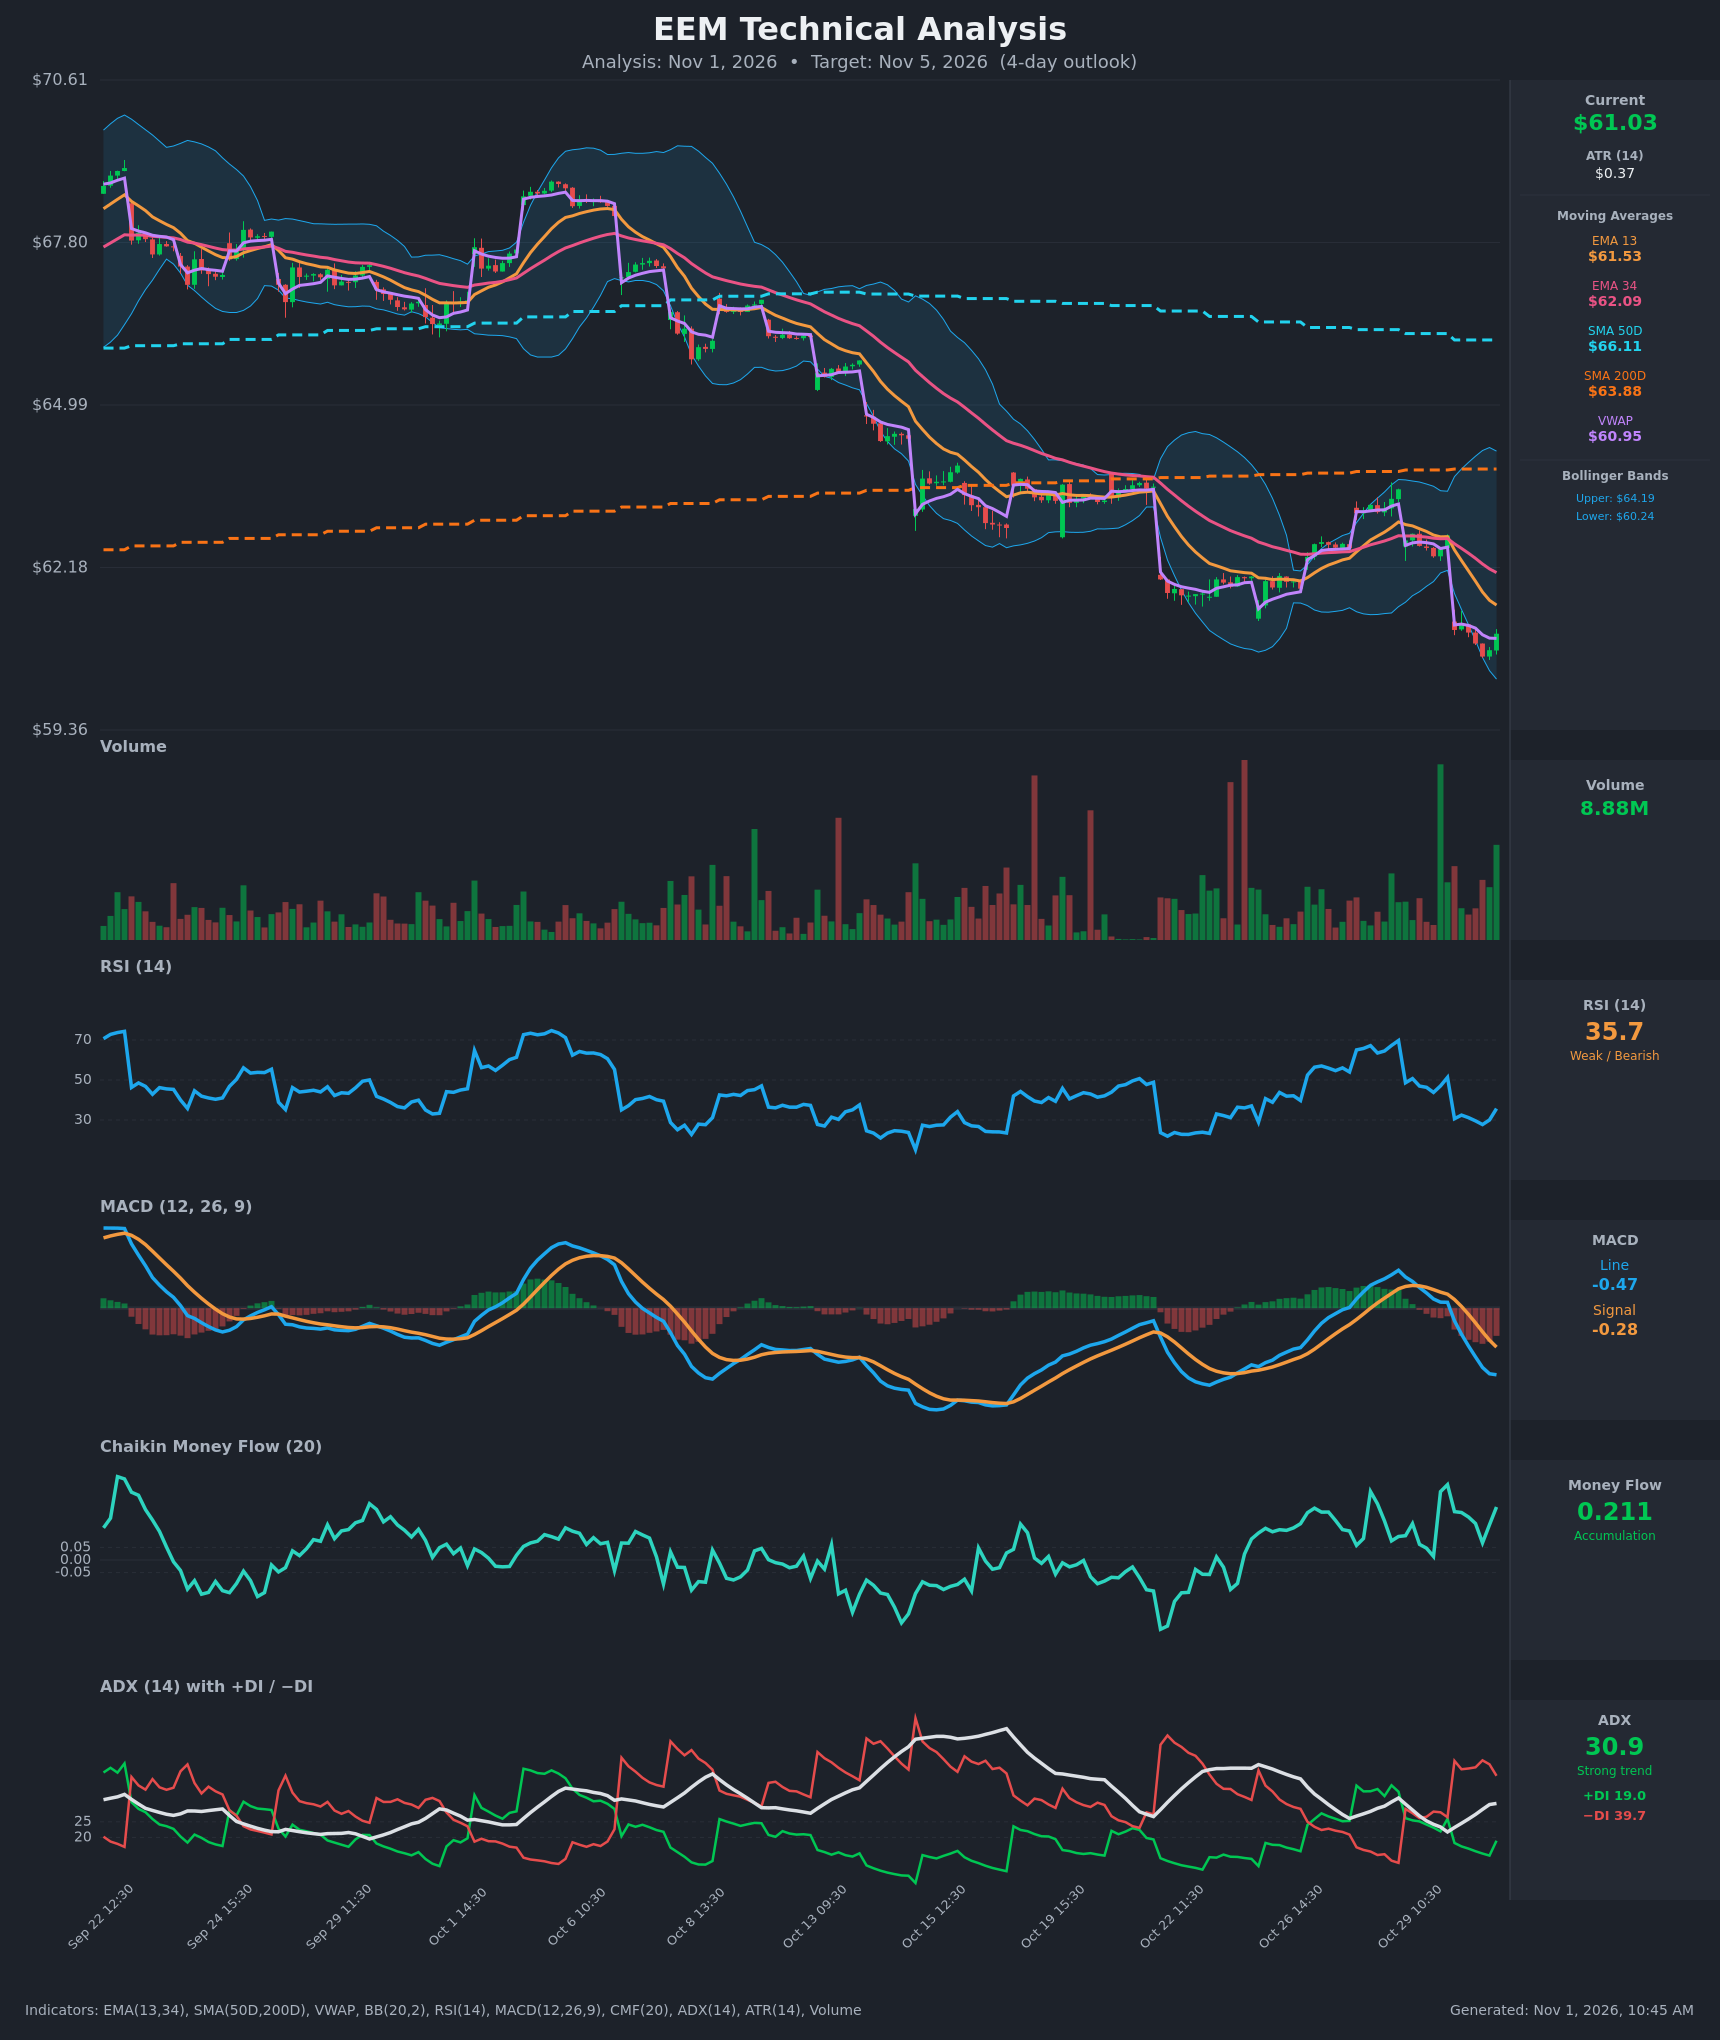
Analysis
TECHNICAL INDICATORS
- RSI (14): 35.69, recovering from 27.7 (oversold-adjacent) but still below 50. Momentum has been weak since the gap-down on Oct 30, with a small bounce off the low. [Bearish]
- 20 EMA: The chart shows EMA 13 at $61.53 and EMA 34 at $62.09. Price at $61.03 is below both, and both are sloping down, so they act as overhead resistance. EMA13 is below EMA34, a bearish alignment. [Bearish]
- MACD: Line -0.472, signal -0.276, histogram about -0.20. The bearish crossover occurred on Oct 30 and the histogram is still widening to the downside, though the pace of decline is slowing. [Bearish]
- Bollinger Bands (20): Upper $64.19, lower $60.24. Price is in the lower quarter of the bands, close to the lower band, after a sharp drop. Price hugging the lower band confirms downside pressure, but it also raises the odds of a short-term mean-reversion bounce toward the midline (about $62.2). [Bearish]
- CMF (20): +0.211, a strong accumulation reading, and it has stayed positive throughout the selloff. It conflicts with price and suggests dip buying or absorption near the lows, which is a mild bullish divergence. [Accumulation]
- ADX (14): 30.9 and rising, with −DI (39.7) well above +DI (19.0). That is a strong established downtrend with bears firmly in control. [Strong Trend – Bearish]
- Volume: 8.88M, with a green bar on the last candle, slightly elevated versus recent bars. The latest bounce came on decent volume, hinting at some buying interest at the lows, but there is no capitulation spike. [Neutral / slight bullish tilt]
DIVERGENCES & TRENDS
- Trend: A persistent downtrend since early October, with lower highs and lower lows. Price is below SMA50D ($66.11) and SMA200D ($63.88), and SMA50D is above SMA200D but both are falling or flat, so the long-term trend is deteriorating.
- Bullish divergence: CMF is strongly positive (+0.21) while price makes new lows. This suggests accumulation, but it has not yet been confirmed by price.
- RSI: It made a higher low (27.7 to 35.7) relative to the intraday sell-off, a mild sign of selling exhaustion on the hourly chart.
- Crossovers: MACD crossed bearish on Oct 30. EMA13 is below EMA34, with a bearish gap. A −DI dominance signal has been present since Oct 30.
- VWAP: Price is slightly above VWAP ($60.95), so the last bounce is holding a hair above it, a minor positive.
CHART PATTERNS
- The broader structure resembles a Bearish Rising Wedge / descending channel continuation. Price is making a series of lower highs and gap-downs (Oct 22, Oct 30), and there has been no base-building yet.
- The Oct 22 to Oct 29 rally into the 200D SMA and the falling EMAs looks like a failed relief rally, a bearish flag-like retracement that broke down on Oct 30. The measured move from the flag points toward $59.5 to $60.0.
- No confirmed reversal pattern (double bottom or inverted H&S) is visible yet. The positive CMF is the only hint of basing.
POTENTIAL SCENARIOS
- Scenario 1: Bearish Trend Continuation — Price stays below the falling EMAs and the strong ADX downtrend keeps pushing it lower toward or below the lower Bollinger Band. Trigger: Break below $60.60 (recent low) on rising volume. Target: $59.90 to $60.20. Invalidation: Close above $61.55 (EMA13). (50% probability)
- Scenario 2: Neutral/Bullish Oversold Bounce — RSI near 35 and positive CMF fuel a mean-reversion bounce to EMA13/EMA34 resistance, then the move stalls. Trigger: Hold above $60.70 and reclaim $61.50. Target: $61.60 to $62.10. Invalidation: Break below $60.40. (35% probability)
- Scenario 3: Sharp Breakdown — Gap-down extension on an emerging-market risk-off move, with price pushing through the lower band. Trigger: Close below $60.24. Target: $59.40 to $59.70. Invalidation: Recovery above $61.00. (15% probability)
PRICE TARGETS
With ATR of $0.37 and a 4-day horizon (about 3-6% range width), the expected move is roughly 1.5 to 2.5 ATR with a bearish drift, partly offset by oversold bounce risk.
- Target Price: $60.55 (for the 4-day timeframe)
- Expected Range: $59.30 to $61.80 (width $2.50, about 4.1% of the current price)
- Key Levels: Support at $60.24 (lower Bollinger Band), Resistance at $61.53 (EMA 13)
OVERALL BIAS
OVERALL BIAS: BEARISH - ADX of 30.9 with −DI far above +DI, a fresh bearish MACD crossover, and price below all key moving averages argue for continued downside, even though the positive CMF and near-oversold RSI could cause a temporary bounce.
This is educational analysis and not financial advice.