EEM 27-day bearish forecast — Nov 15, 2026
- Bias: Bearish
- Timeframe: 27 days (made Nov 15, 2026, target date Dec 11, 2026)
- Price at analysis: $60.92
- Price target: $59.50
- Expected range: $55.80 – $63.80
- Result: Pending — graded after the close on Dec 11, 2026
Get a free AI analysis of EEM today
Analysis
TECHNICAL INDICATORS
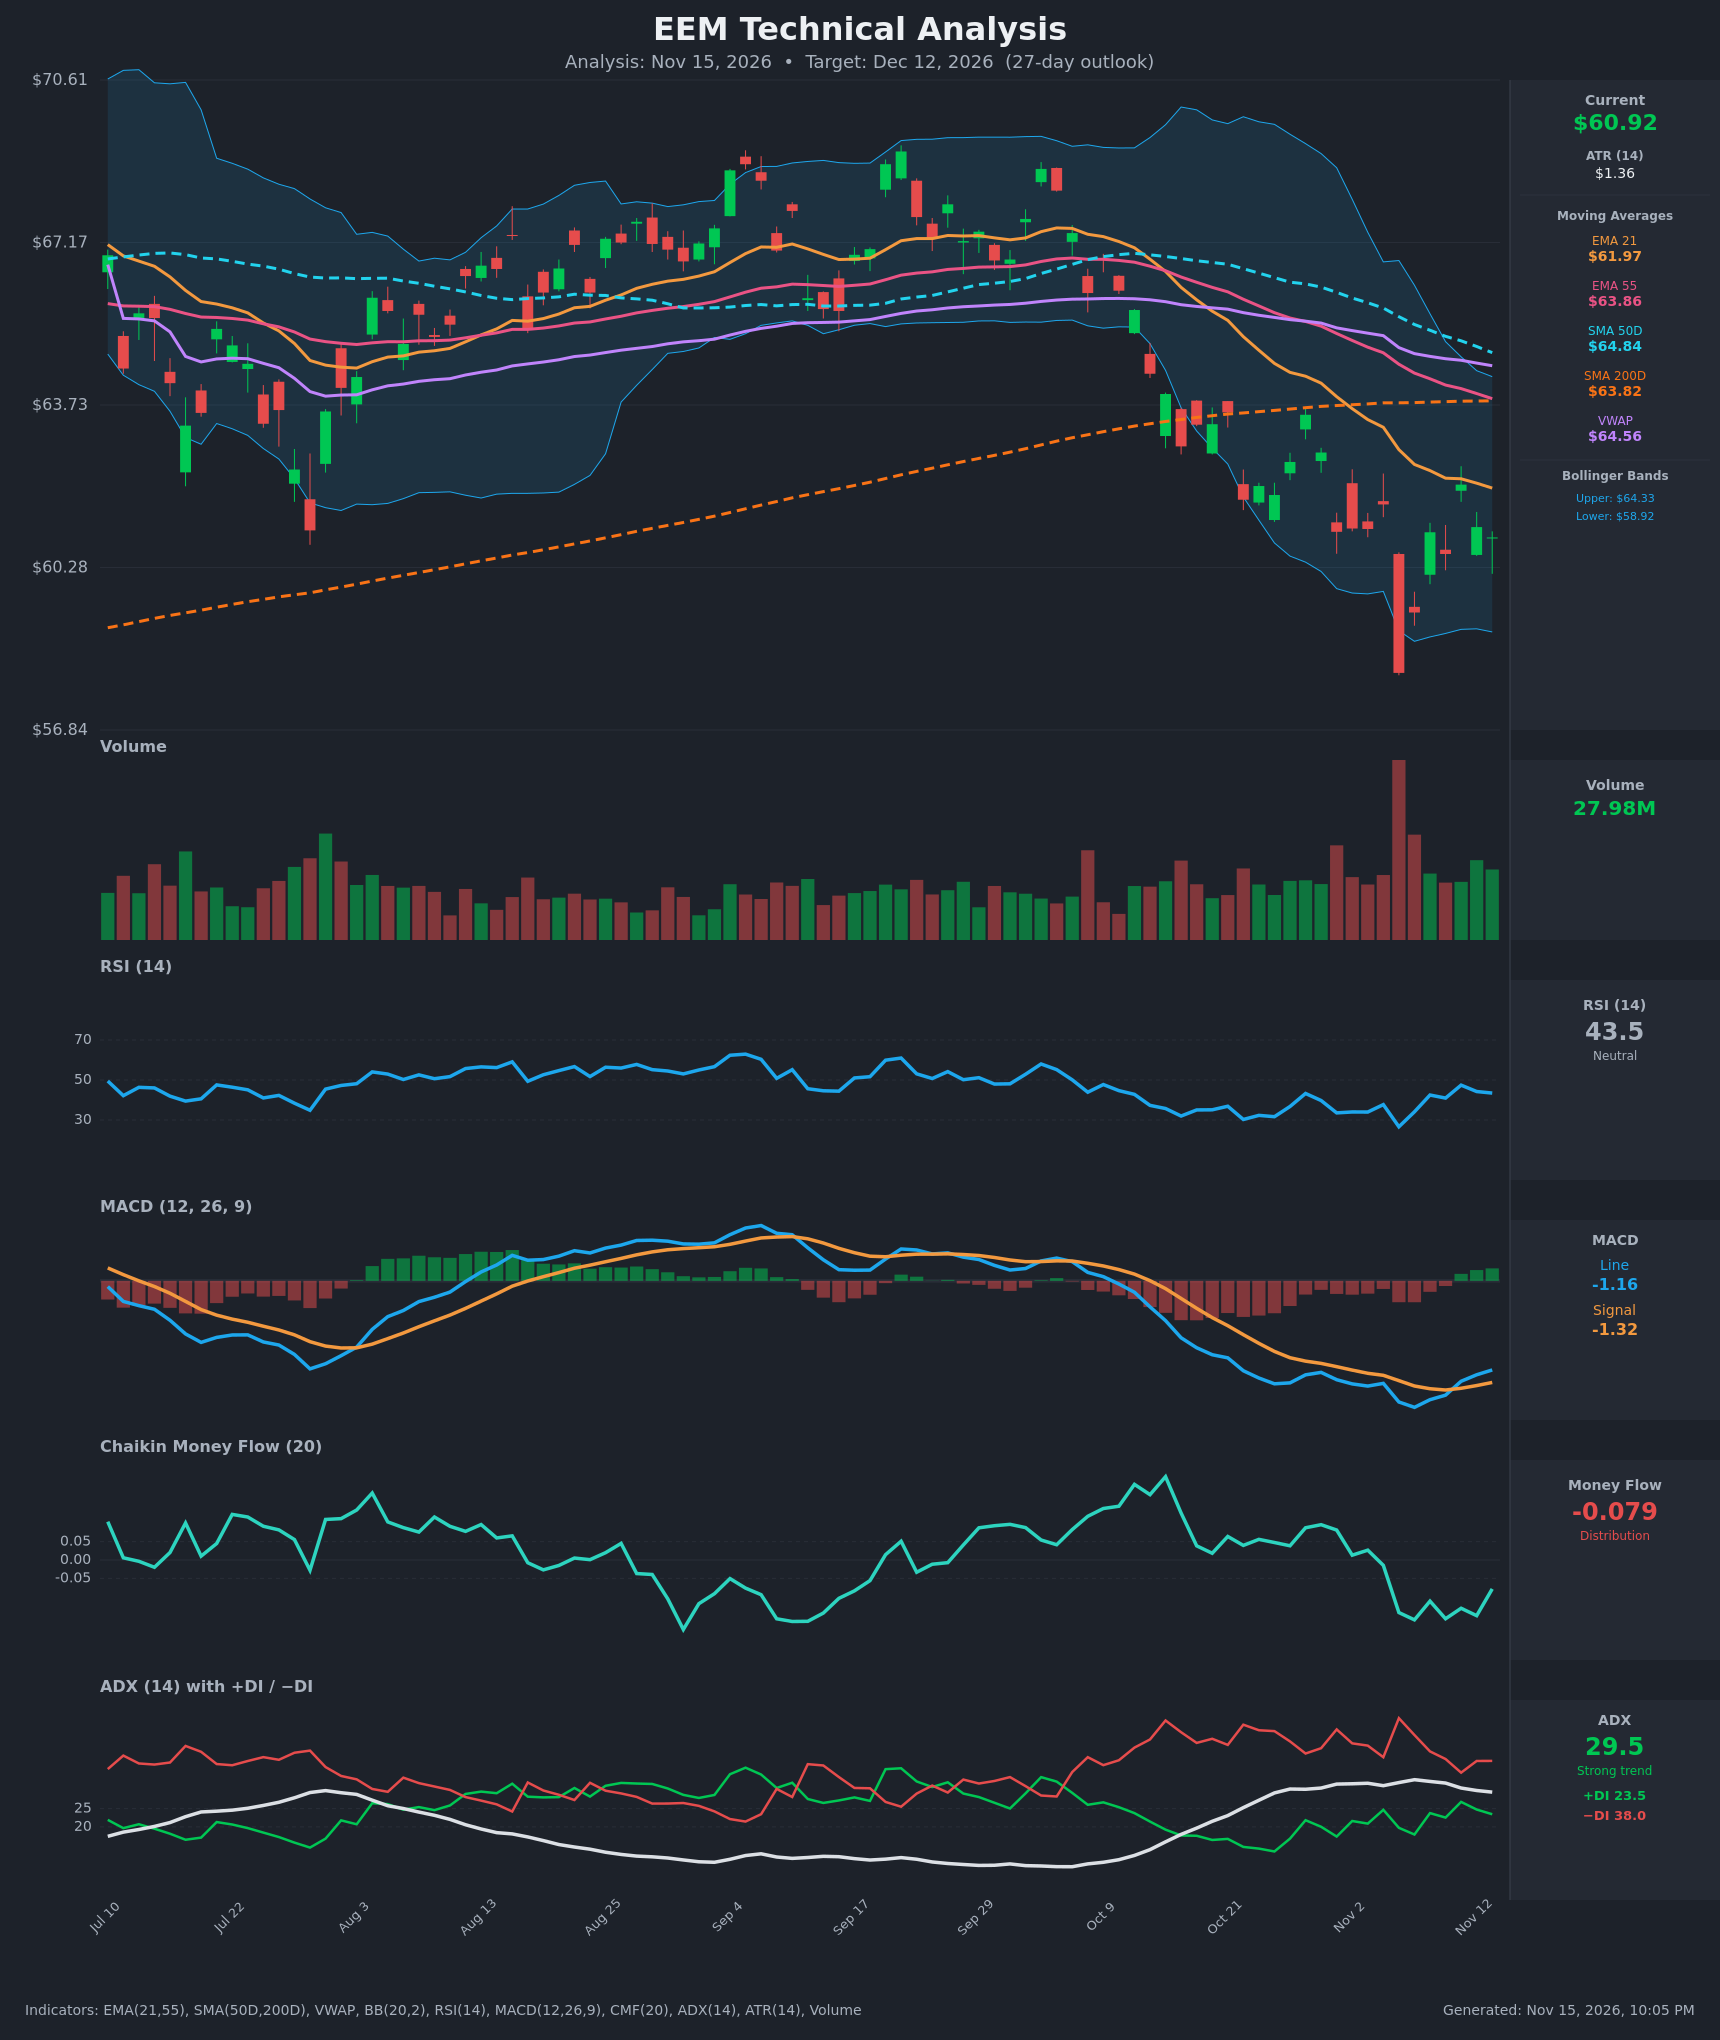
- RSI (14): 43.47. It is below 50 but well off the Nov 5 low of 26.6, and it has been making higher lows since then. Momentum is improving from oversold but remains sub-50. [Neutral]
- 20 EMA: The EMA21 is $61.97 and price at $60.92 is below it. The EMA21 is also below the EMA55 ($63.86), so the short-term trend is down and the EMA21 acts as resistance. [Bearish]
- MACD: The line is -1.159 and the signal is -1.322. The line has crossed above the signal (around Nov 11) and the histogram is slightly positive and rising. This is a bullish momentum turn, but both lines are still deep below zero, so it looks like a relief bounce rather than a trend reversal. [Bullish]
- Bollinger Bands (20): The bands run from $58.92 to $64.33, with a midline near $61.62. Price sits in the lower half, below the midline, after the Nov 5 plunge pierced the lower band. The bands are wide and starting to contract. [Bearish]
- CMF (20): -0.079, which is below -0.05. It has been negative since Nov 4 and bounced only slightly from its lows. Selling pressure persists. [Distribution]
- ADX (14): 29.5, a strong trend but slightly off its peak of about 32.9. −DI (38.0) is well above +DI (23.5), so bears control the trend. The gap has narrowed from the Nov 5 extreme. [Strong Trend – Bearish]
- Volume: 27.98M, near average on the latest bars. The Nov 5 capitulation drop came on the highest volume of the period, and the bounce since has come on lighter volume. This suggests the bounce lacks strong buying conviction. [Neutral to Bearish]
DIVERGENCES & TRENDS
- Death cross: SMA50D ($64.84) has been above SMA200D ($63.82) but is falling steadily and converging on it. It is about $1.02 away and likely to cross below within the 27-day window, which would be a bearish long-term signal.
- Price vs. long-term averages: Price is below the SMA200D, EMA21, EMA55, SMA50D and VWAP ($64.56). Every major average is overhead resistance.
- MACD vs. price: The MACD bullish crossover with a rising histogram, while price is still making lower highs and lows below the EMAs, is mild positive momentum divergence. It is not confirmed by CMF, which remains negative.
- RSI: The Nov 5 low (26.6) was followed by higher lows in the 34–44 range, a constructive sign. It remains capped under 50.
- DI lines: −DI is above +DI, but the spread has narrowed from 49.7 vs 19.7 to 38.0 vs 23.5, so downside momentum is fading.
- Price action: The Oct–Nov decline was a sharp breakdown from the $65–67 range. The bounce is now stalling below the declining EMA21.
CHART PATTERNS
- Prior structure: There is a rounded top and range between roughly $63 and $67 from August to October. It broke down in a manner resembling a Bearish Triple Top / Head and Shoulders-style reversal, with the neckline around $63.5–64 lost.
- Current structure: Since the Nov 5 capitulation low near $58, price has been consolidating in a small, choppy range of about $58–$62. This resembles a Bearish Flag/Pennant continuation pattern. It has no clear bullish reversal base such as a double bottom or inverse head and shoulders.
- Target logic: A flag breakdown below ~$59.5 would project toward the $57–58 area. A bounce is more likely to be capped at the $63.8 SMA200D/neckline zone, which was prior support and is now resistance.
POTENTIAL SCENARIOS
- Scenario 1: Bearish Continuation Lower — Price fails at the EMA21 ($61.97) and the lower-high structure persists, with −DI dominance, negative CMF, and the SMA50D/200D death cross pressuring sentiment. Trigger: close below $59.50 and the Nov 5 low zone (~$58.05). Target: $57.50–$58.50. Invalidation: daily close above $62.50. (50% probability)
- Scenario 2: Bullish Relief Rally — The MACD bullish cross and the oversold bounce extend into a mean-reversion move toward the declining EMAs and the SMA200D. Trigger: close above $62.00 EMA21 on rising volume. Target: $63.50–$64.30 (SMA200D / Bollinger upper). Invalidation: close below $59.50. (30% probability)
- Scenario 3: Neutral Range Consolidation — Price chops between $58.50 and $62.50 as ADX fades from its peak and momentum is mixed. Trigger: failure to break either side of the range. Target: $60–$62. Invalidation: close outside $58.50–$62.50. (20% probability)
PRICE TARGETS
For a 27-day timeframe the range should be ~12–18% of the current price. The Expected Range is $55.80 to $63.80, a width of $8.00 (13.1%), which fits that guidance.
- Target Price: $59.50 (27 days)
- Expected Range: $55.80 to $63.80
- Key Levels: Support at $58.05, Resistance at $61.97
OVERALL BIAS
OVERALL BIAS: BEARISH - Price is below all key moving averages with −DI dominating, CMF in distribution, and a pending SMA50/200 death cross. The MACD bullish crossover suggests only a relief bounce, with resistance at the $61.97 EMA21 and the $63.8 SMA200D.
This is educational analysis and not financial advice.