EEM 62-day bearish forecast — Nov 15, 2026
- Bias: Bearish
- Timeframe: 62 days (made Nov 15, 2026, target date Jan 15, 2027)
- Price at analysis: $60.92
- Price target: $59.40
- Expected range: $53.60 – $65.20
- Result: Pending — graded after the close on Jan 15, 2027
Get a free AI analysis of EEM today
Analysis
TECHNICAL INDICATORS
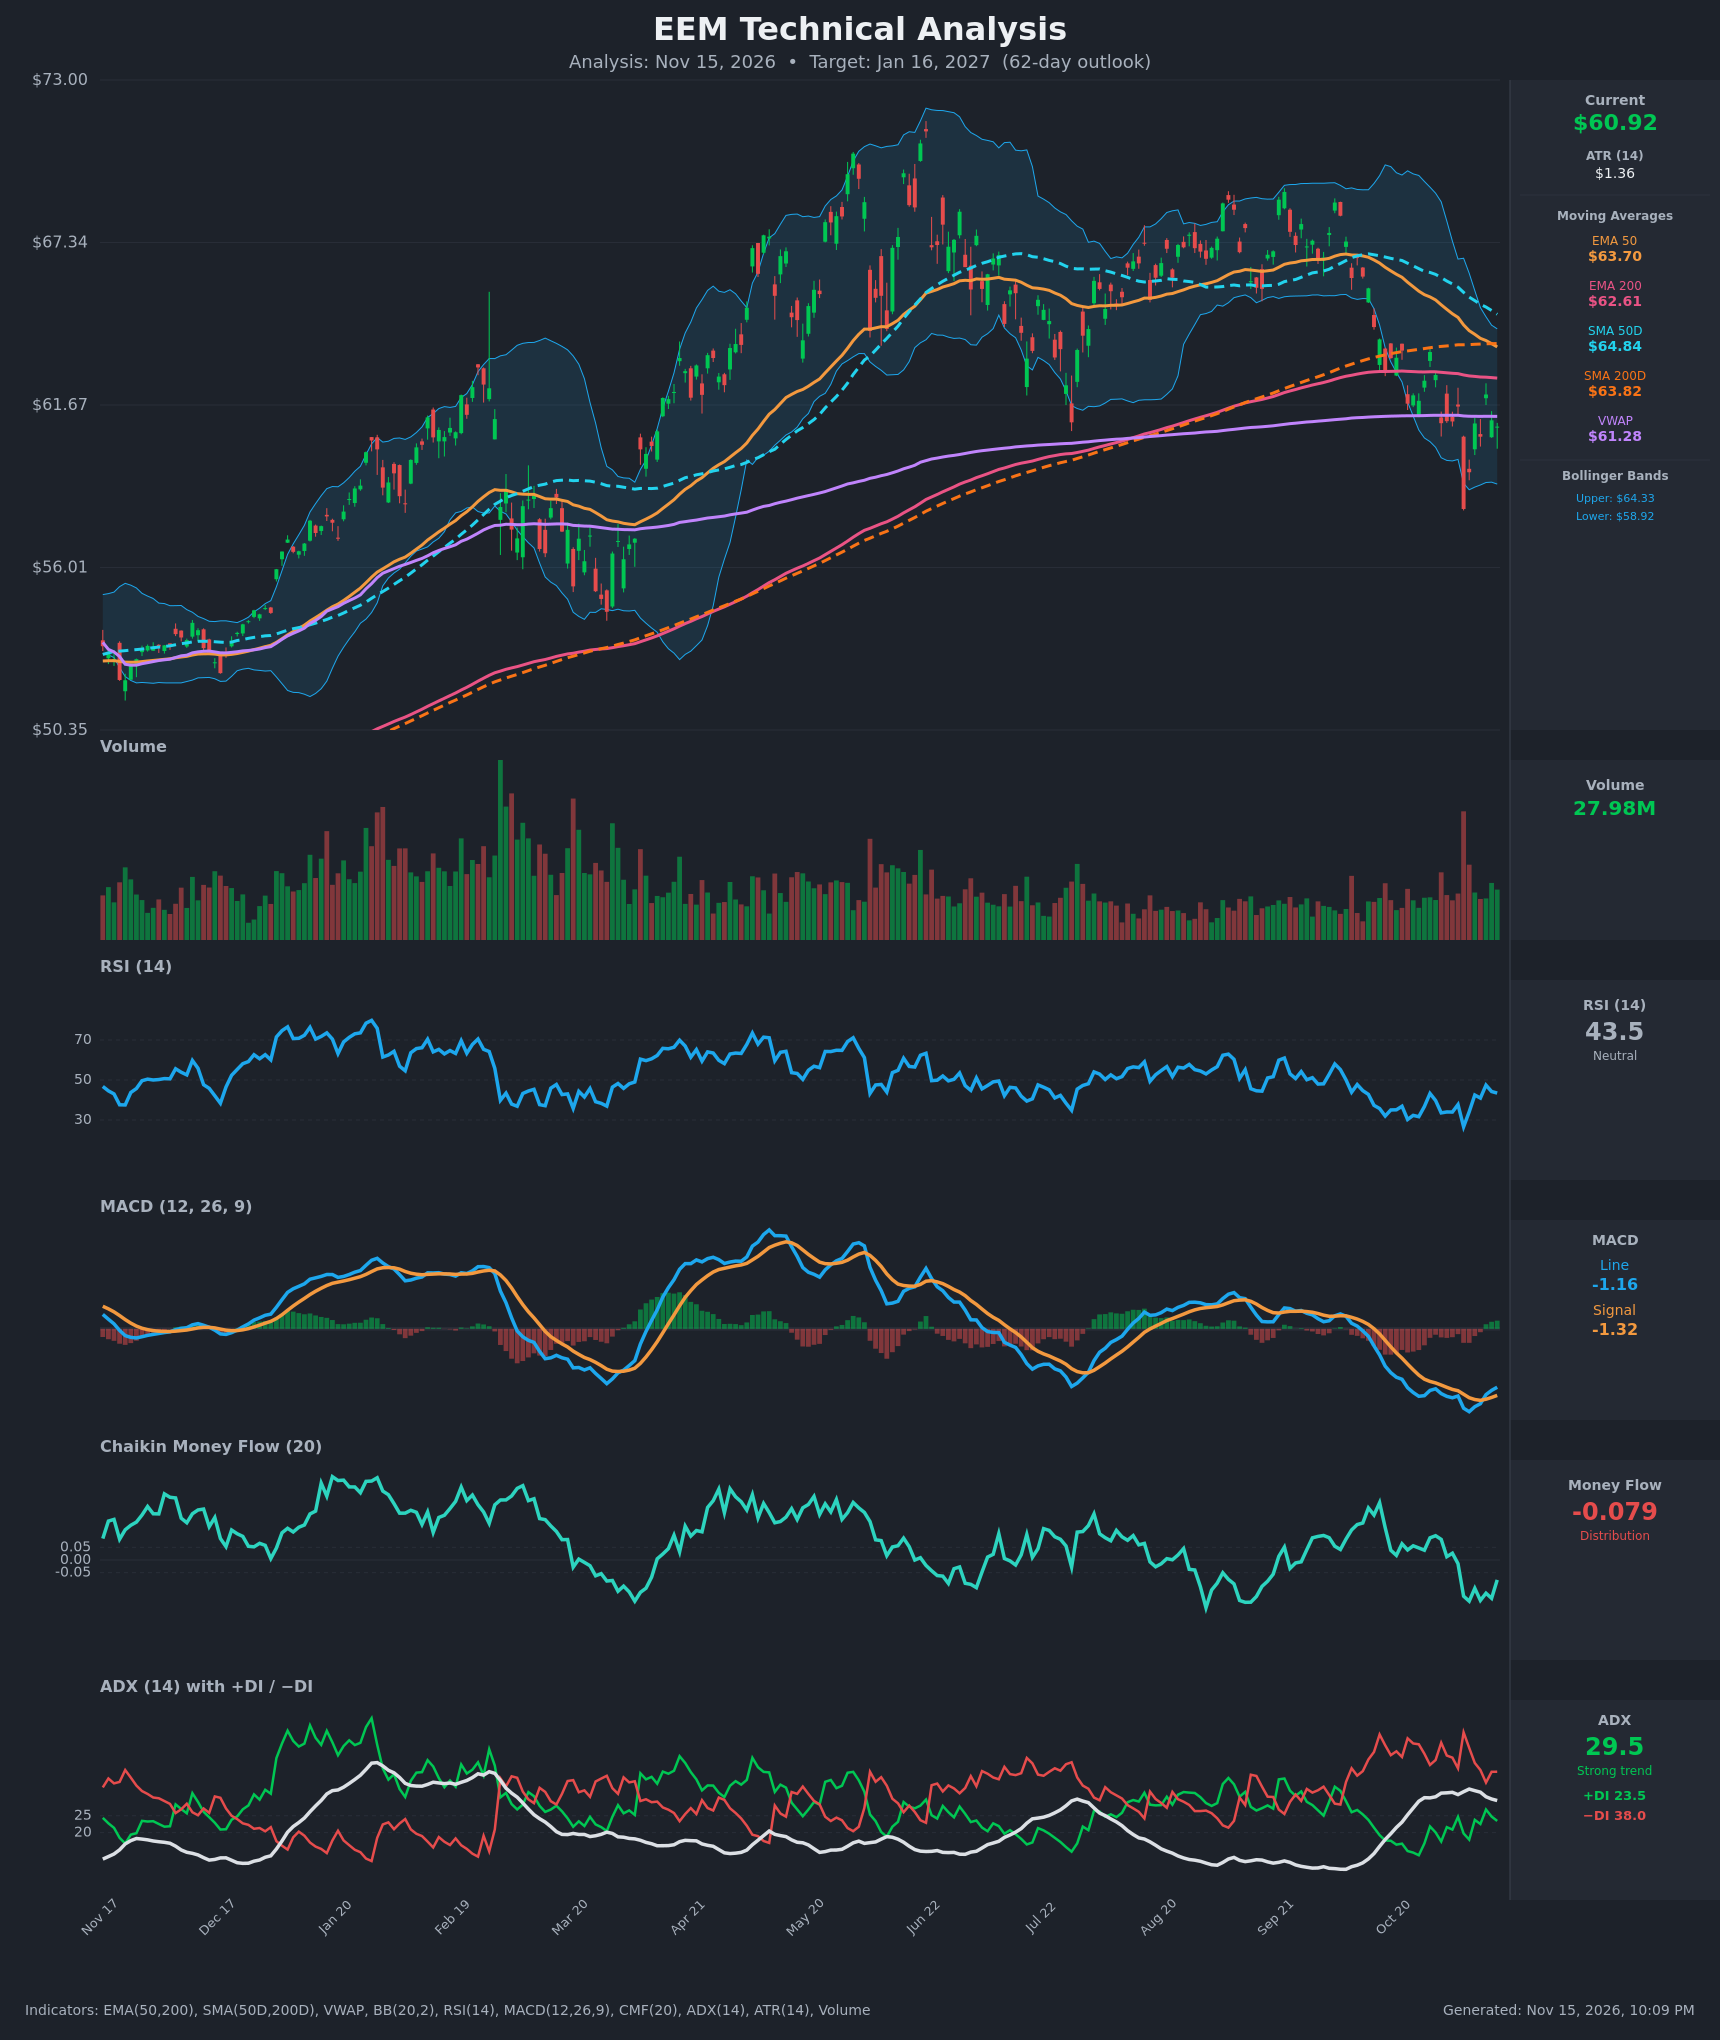
- RSI (14): 43.47. It is below 50 but well off the Nov 5 oversold low of 26.6. It has been making a series of higher lows since then, but it is capped under 50 (47.4 on Nov 11) and is not showing bullish strength. [Bearish]
- 20 EMA: The 20 EMA is not supplied, so I use the 50 EMA at $63.70 as the nearest dynamic reference. Price at $60.92 sits about 4.4% below it, and the EMA is falling steadily (65.64 → 63.70 in 15 bars), so it acts as resistance. VWAP at $61.28 is also just overhead. [Bearish]
- MACD: Line -1.159 is above Signal -1.322, with a small positive histogram. The line crossed above the signal around Nov 11. Both lines are still deep in negative territory and near their cycle lows, so this is a weak relief cross inside a downtrend rather than a trend reversal. [Neutral]
- Bollinger Bands (20): Upper $64.33, lower $58.92, with price in the lower half at $60.92 and the midline near $61.6. Price tagged or pierced the lower band on the Nov 5 flush ($58.05) and has bounced. The bands are starting to turn down after the October breakdown. [Bearish]
- CMF (20): -0.079, below the -0.05 threshold. It has fallen from positive (+0.09 in late October) to negative since Nov 4, with the Nov 5 high-volume selloff driving the shift. This is distribution, with only a slight uptick at the latest bar. [Distribution]
- ADX (14): 29.5 with −DI 38.0 above +DI 23.5. ADX is above 25, so the trend is strong, and the bears control it. ADX is edging down from its 32.9 peak, which means trend momentum is cooling slightly. The gap between −DI and +DI has narrowed from 46/13 to 38/23.5. [Strong Trend – Bearish]
- Volume: 27.98M on the latest bar. The Nov 5 breakdown candle had the highest volume on the chart in months, and it was a down day. Recent bounce days show average volume, so the rally lacks conviction. [Bearish – heavy volume on selling, light on the bounce]
DIVERGENCES & TRENDS
- Moving-average structure: Price is below EMA50, EMA200, SMA50D, SMA200D and VWAP. The $62.6–63.8 zone (EMA200/SMA200D) was lost in late October and now acts as overhead resistance.
- Converging averages: EMA50 ($63.70) is falling toward EMA200 ($62.61), a gap of only $1.09 and closing about $0.10 per bar. A bearish EMA death cross is likely within roughly 10 bars. SMA50D ($64.84) vs SMA200D ($63.82) is also narrowing, so an SMA death cross is plausible within the 62-day window.
- Minor bullish divergence: RSI and MACD made higher lows after Nov 5 while price held above $58, which is a modest sign of selling exhaustion.
- Bearish context: The bounce has stalled below the 62–62.6 zone, and the DI spread still favors sellers.
- MACD: The bullish crossover is happening below zero, which is historically a low-reliability signal.
- Larger structure: The chart shows a lower high in the Oct/Sep area (~$69) versus the ~$72 peak in May/June, followed by the October breakdown.
CHART PATTERNS
- Bearish Flag / Pennant (continuation): After the sharp drop from about $65 to $58, the current bounce is a small, low-volume, upward-drifting consolidation under resistance at $62–62.6. A break below $58 would project a measured move of about $7 (the flagpole), toward about $53–55.
- Bearish Head and Shoulders / lower-high topping structure (reversal): The May/June peak, a lower September/October high and the break of the ~$62–64 neckline-like zone fit this loosely. The next major supports are the Aug low (~$61, already breached) and then the $56–58 area.
- Invalidating the pattern: A sustained close above $63.8 (SMA200D) would negate the flag and shift the structure toward a range between $58 and $64.
POTENTIAL SCENARIOS
- Scenario 1: Bearish Flag Breakdown / Trend Continuation — Relief bounce fails at EMA200/VWAP, the EMA death cross completes, and price breaks the Nov 5 low with −DI still dominant. Trigger: close below $58.05 on rising volume. Target: $55.00–$56.00, extending to $53.50. Invalidation: daily close above $63.80. (50% probability)
- Scenario 2: Neutral Range Consolidation — Price chops between the $58 support and $62.6–63.8 resistance as ADX fades and the MACD stays near its signal line. Trigger: repeated failures at $62.6 and holds above $58. Target: $58.50–$62.50. Invalidation: close above $64 or below $57.50. (20% probability)
- Scenario 3: Bullish Relief Rally / Reclaim of Moving Averages — The MACD crossover and RSI higher lows lead to a squeeze through VWAP and EMA200, with a rally into the falling EMA50 and SMA50D. Trigger: close above $62.61 then $63.82, with CMF back above zero. Target: $64.30–$65.00. Invalidation: close below $58.00. (30% probability)
PRICE TARGETS
For the 62-day horizon (to about Jan 16, 2027):
- Target Price: $59.40
- Expected Range: $53.60 to $65.20 (width $11.60, about 19% of current price, consistent with the 61–180 day guidance)
- Key Levels: Support at $58.05, Resistance at $62.61
OVERALL BIAS
OVERALL BIAS: BEARISH - Price is below all major moving averages with −DI well above +DI (ADX 29.5), CMF is in distribution, and the EMA50/EMA200 are converging toward a death cross. The recent MACD cross and RSI higher lows point to a relief bounce, but the bounce lacks volume and is likely to stall under $62.6.
This is educational analysis and not financial advice.