EEM 34-day bearish forecast — Nov 15, 2026
- Bias: Bearish
- Timeframe: 34 days (made Nov 15, 2026, target date Dec 18, 2026)
- Price at analysis: $60.92
- Price target: $59.60
- Expected range: $56.00 – $64.20
- Result: Pending — graded after the close on Dec 18, 2026
Get a free AI analysis of EEM today
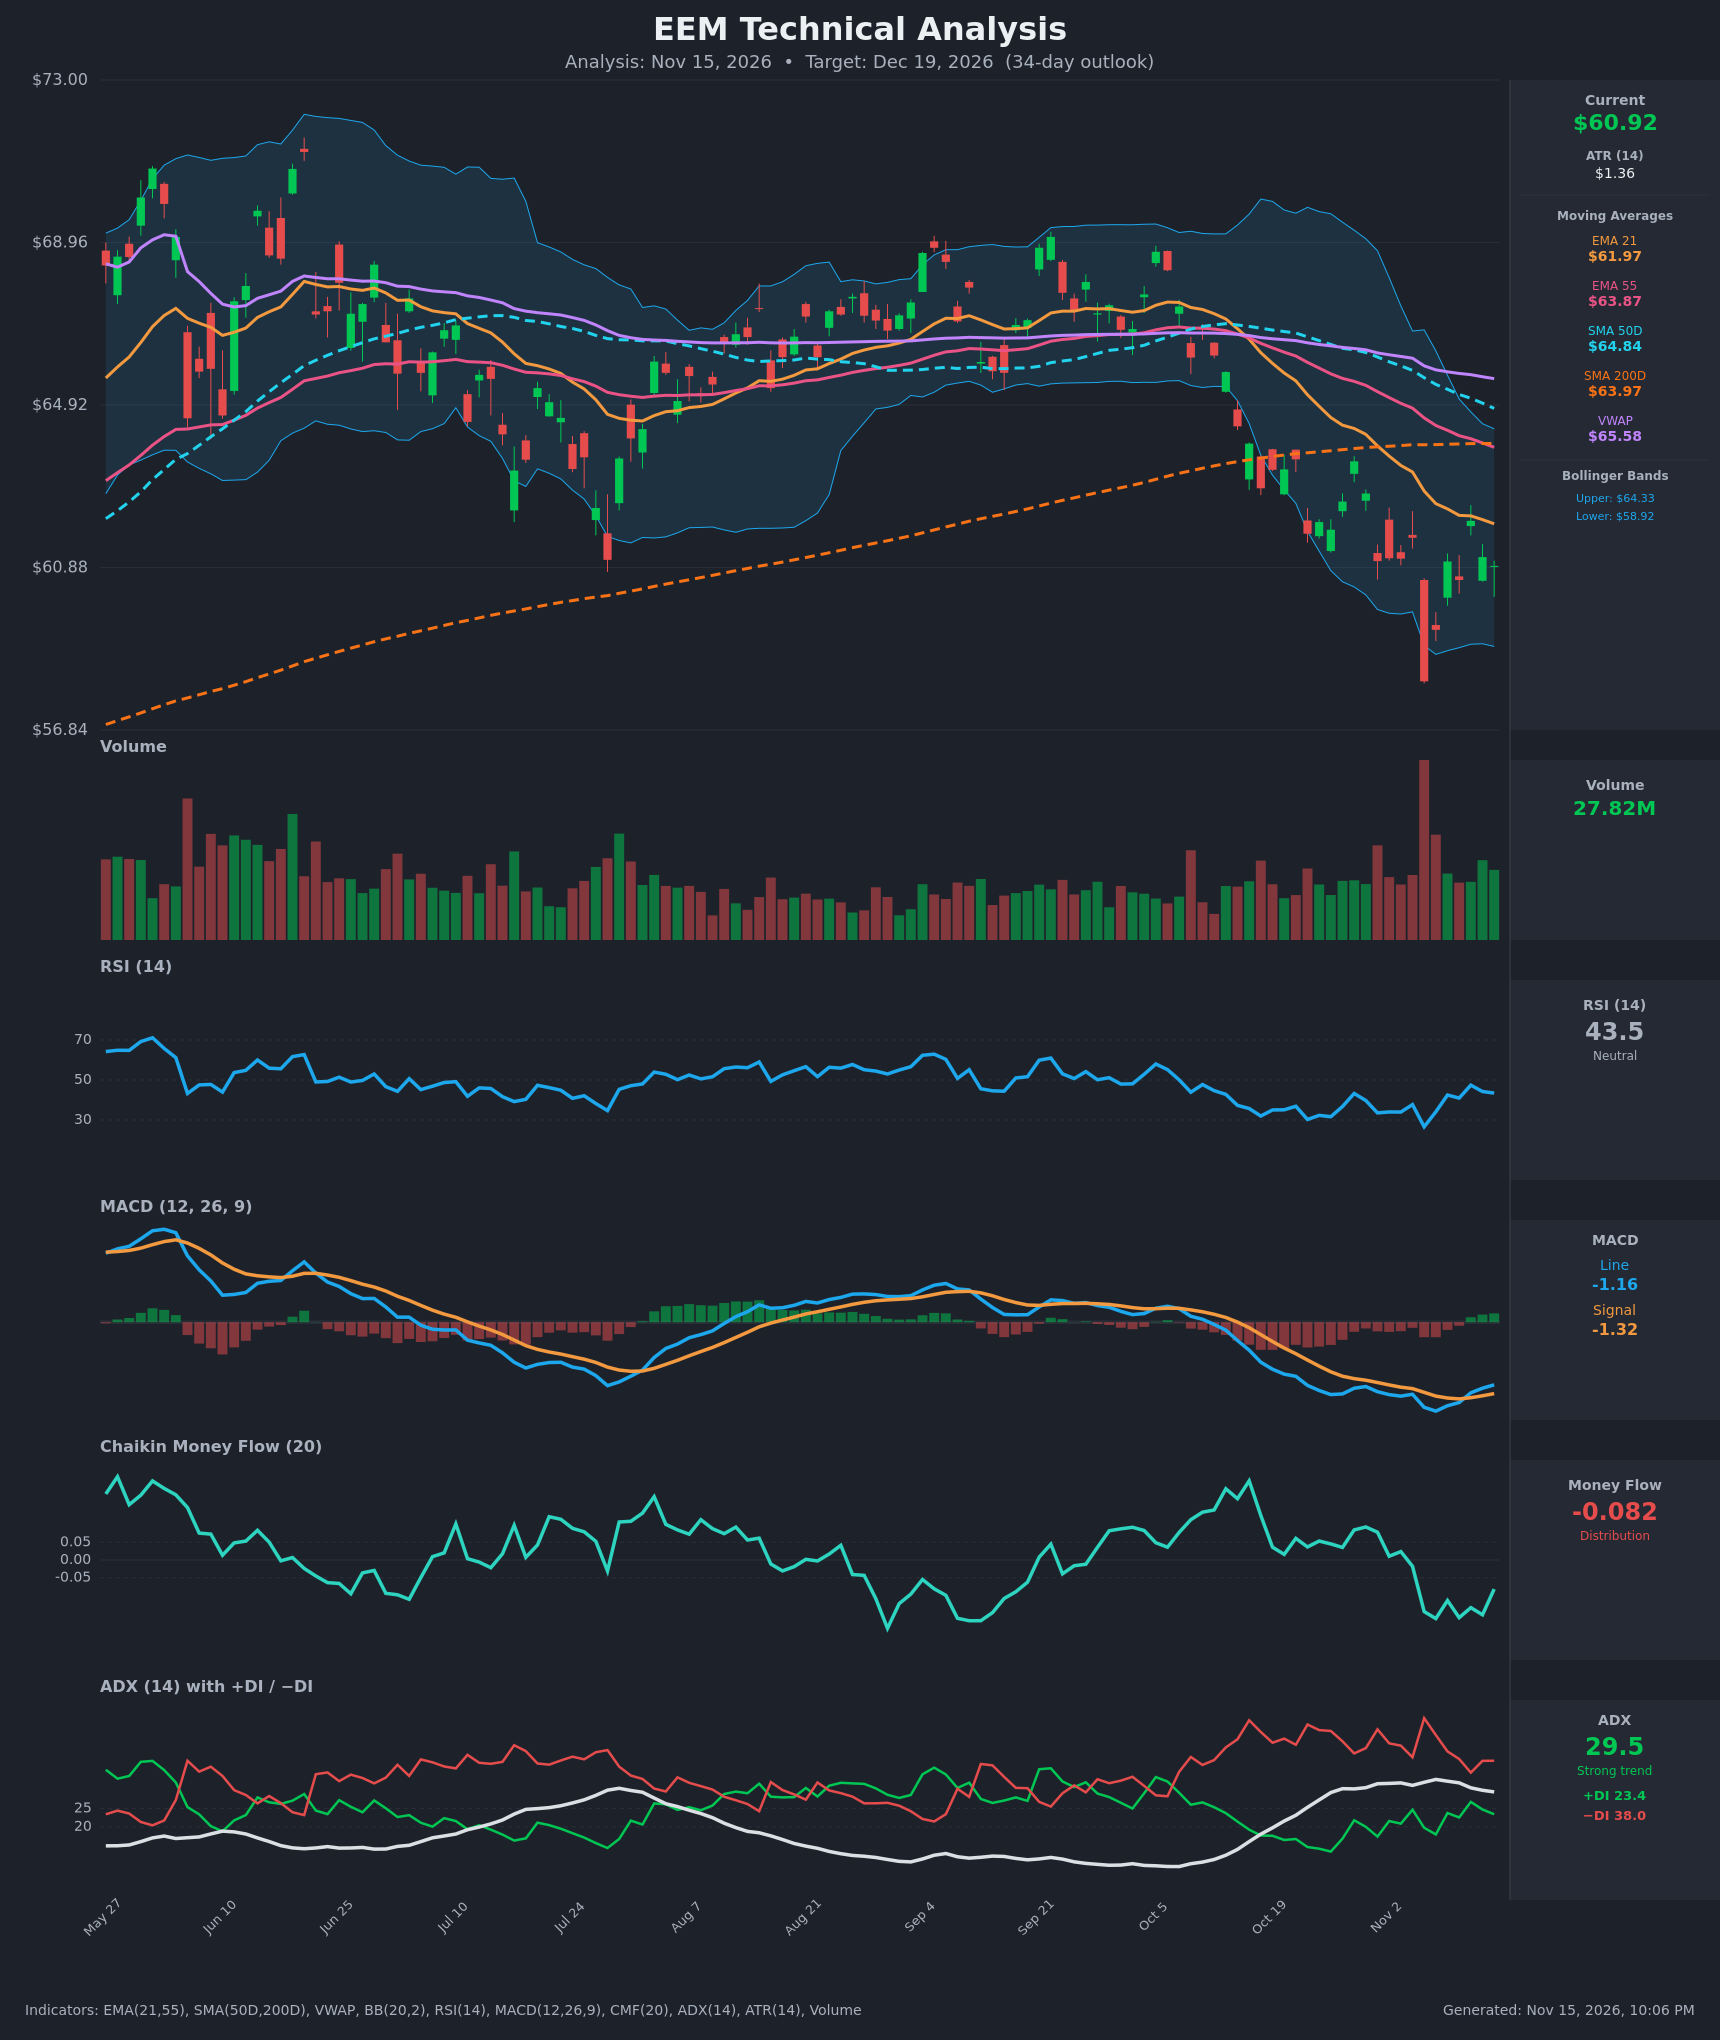
Analysis
TECHNICAL INDICATORS
- RSI (14): 43.47, below the 50 midline but recovering from the 26.6 oversold extreme on Nov 5. Momentum is improving but still in bearish territory, and it has stalled in the 41-47 zone. [Neutral]
- 20 EMA (EMA 21 = $61.97): Price at $60.92 is below the EMA 21, which is falling and acting as resistance. The EMA 21 is also below the EMA 55 ($63.87), so the bearish cross is already in place. The Nov 11 close at $62.04 barely reached it and was rejected. [Bearish]
- MACD: Line -1.159 is above signal -1.322 (positive histogram of about +0.16), a fresh bullish crossover on Nov 11-12. Both lines are still well below zero, so this looks like a relief bounce within a downtrend rather than a trend reversal. [Neutral]
- Bollinger Bands (20): Upper $64.33, lower $58.92, mid-band about $61.6. Price sits just below the mid-band after tagging and piercing the lower band on Nov 5. The bands are expanding from the breakdown and the mid-band is sloping down. [Bearish]
- CMF (20): -0.082, below the -0.05 threshold. It has been negative since Nov 4 and made a low of -0.166, which shows persistent selling pressure with only a slight improvement. [Distribution]
- ADX (14): 29.5 and easing from 32.9, with -DI (38.0) well above +DI (23.4). The trend is strong and bearish, but the DI spread is narrowing (+DI rising from 17.9, -DI falling from 49.7), so selling pressure is fading. [Strong Trend - Bearish]
- Volume: 27.82M, with a huge spike on the Nov 5 capitulation candle ($58.05). Recent bounce days show moderate volume, with green bars slightly outnumbering red. This suggests some dip-buying but no decisive accumulation. [Neutral to slightly Bullish]
- Other MAs: Price is below SMA200D ($63.97), SMA50D ($64.84) and VWAP ($65.58). SMA50D is still above SMA200D but converging fast, so a death cross is a real risk in the coming weeks. [Bearish]
DIVERGENCES & TRENDS
- Price made a new low at $58.05 on Nov 5, and the RSI low of 26.6 coincided with it. There is no clean bullish divergence, though the subsequent price low ($59.33) came with a higher RSI (34.1), which is a minor sign of stabilization.
- MACD turned up before price recovered. The bullish line/signal cross is a near-term positive, but it is occurring far below zero, which historically gives weak follow-through in strong downtrends.
- The EMA 21 crossed below the EMA 55 in late October. The price breakdown through the SMA200D (about $63.9) in late October was a major trend break.
- ADX is rolling over from its peak while -DI still dominates. This points to a decelerating downtrend that could consolidate, not a confirmed reversal.
- CMF has not confirmed the bounce. It remains negative while price rises, which is a bearish non-confirmation.
- Price has made lower highs: roughly $63.5 on Oct 28, then $61.6, then $62.0.
CHART PATTERNS
- Bearish Flag / Bearish Pennant (continuation): After the sharp leg down to $58.05, price has been grinding up in a small, tight rising channel under the EMA 21. This fits the bearish flag template. A break below roughly $59.3-$58.0 would confirm it, with a measured-move target in the mid-$50s, though I expect only partial follow-through within 34 days.
- Bullish Falling Wedge (alternative): The October-November decline inside converging lines has wedge characteristics. A close above about $62-$62.5 (EMA 21) would activate a reversal toward $64 (SMA200D / upper Bollinger Band).
- The prior breakdown below the Jun-Oct range, with the SMA200D lost as support, is a bearish structural signal. The SMA200D is now overhead resistance.
POTENTIAL SCENARIOS
- Scenario 1: Bearish Flag Breakdown / Trend Continuation — Price fails at the EMA 21 and the down-sloping mid-band, then rolls over as -DI stays on top and CMF stays negative. Trigger: close below $59.30, then below $58.05. Target: $58.00, with an extension to about $56.50. Invalidation: daily close above $62.50. (45% probability)
- Scenario 2: Bullish Relief Rally / Mean Reversion — The MACD cross, fading ADX and oversold capitulation fuel a rebound toward the overhead moving averages. Trigger: close above $62.00 on rising volume. Target: $63.90-$64.30 (SMA200D / upper band). Invalidation: close back below $59.30. (30% probability)
- Scenario 3: Neutral Basing Range — Price chops between the capitulation low and the EMA 21 while ADX falls below 25. Trigger: repeated failures at $62 and holds above $58.50. Target: $59.50-$61.50. Invalidation: close outside $58.00-$62.50. (25% probability)
PRICE TARGETS
- Target Price: $59.60 (34-day outlook)
- Expected Range: $56.00 to $64.20 (width $8.20, about 13.5% of the current price, consistent with the 30-60 day guidance)
- Key Levels: Support at $58.05, Resistance at $61.97
OVERALL BIAS
OVERALL BIAS: BEARISH - Price is below the EMA 21, EMA 55, SMA50D, SMA200D and VWAP, with -DI dominating at ADX 29.5 and CMF in distribution. The recent MACD cross and the bounce from capitulation look like a relief rally inside a bearish-flag structure, and the EMA 21 and SMA200D overhead are likely to cap it. Conviction is modest because of the fading ADX and the improving RSI/MACD.
This is educational analysis and not financial advice.