EEM 48-day bearish forecast — Nov 15, 2026
- Bias: Bearish
- Timeframe: 48 days (made Nov 15, 2026, target date Jan 1, 2027)
- Price at analysis: $60.92
- Price target: $59.20
- Expected range: $55.80 – $64.80
- Result: Pending — graded after the close on Jan 1, 2027
Get a free AI analysis of EEM today
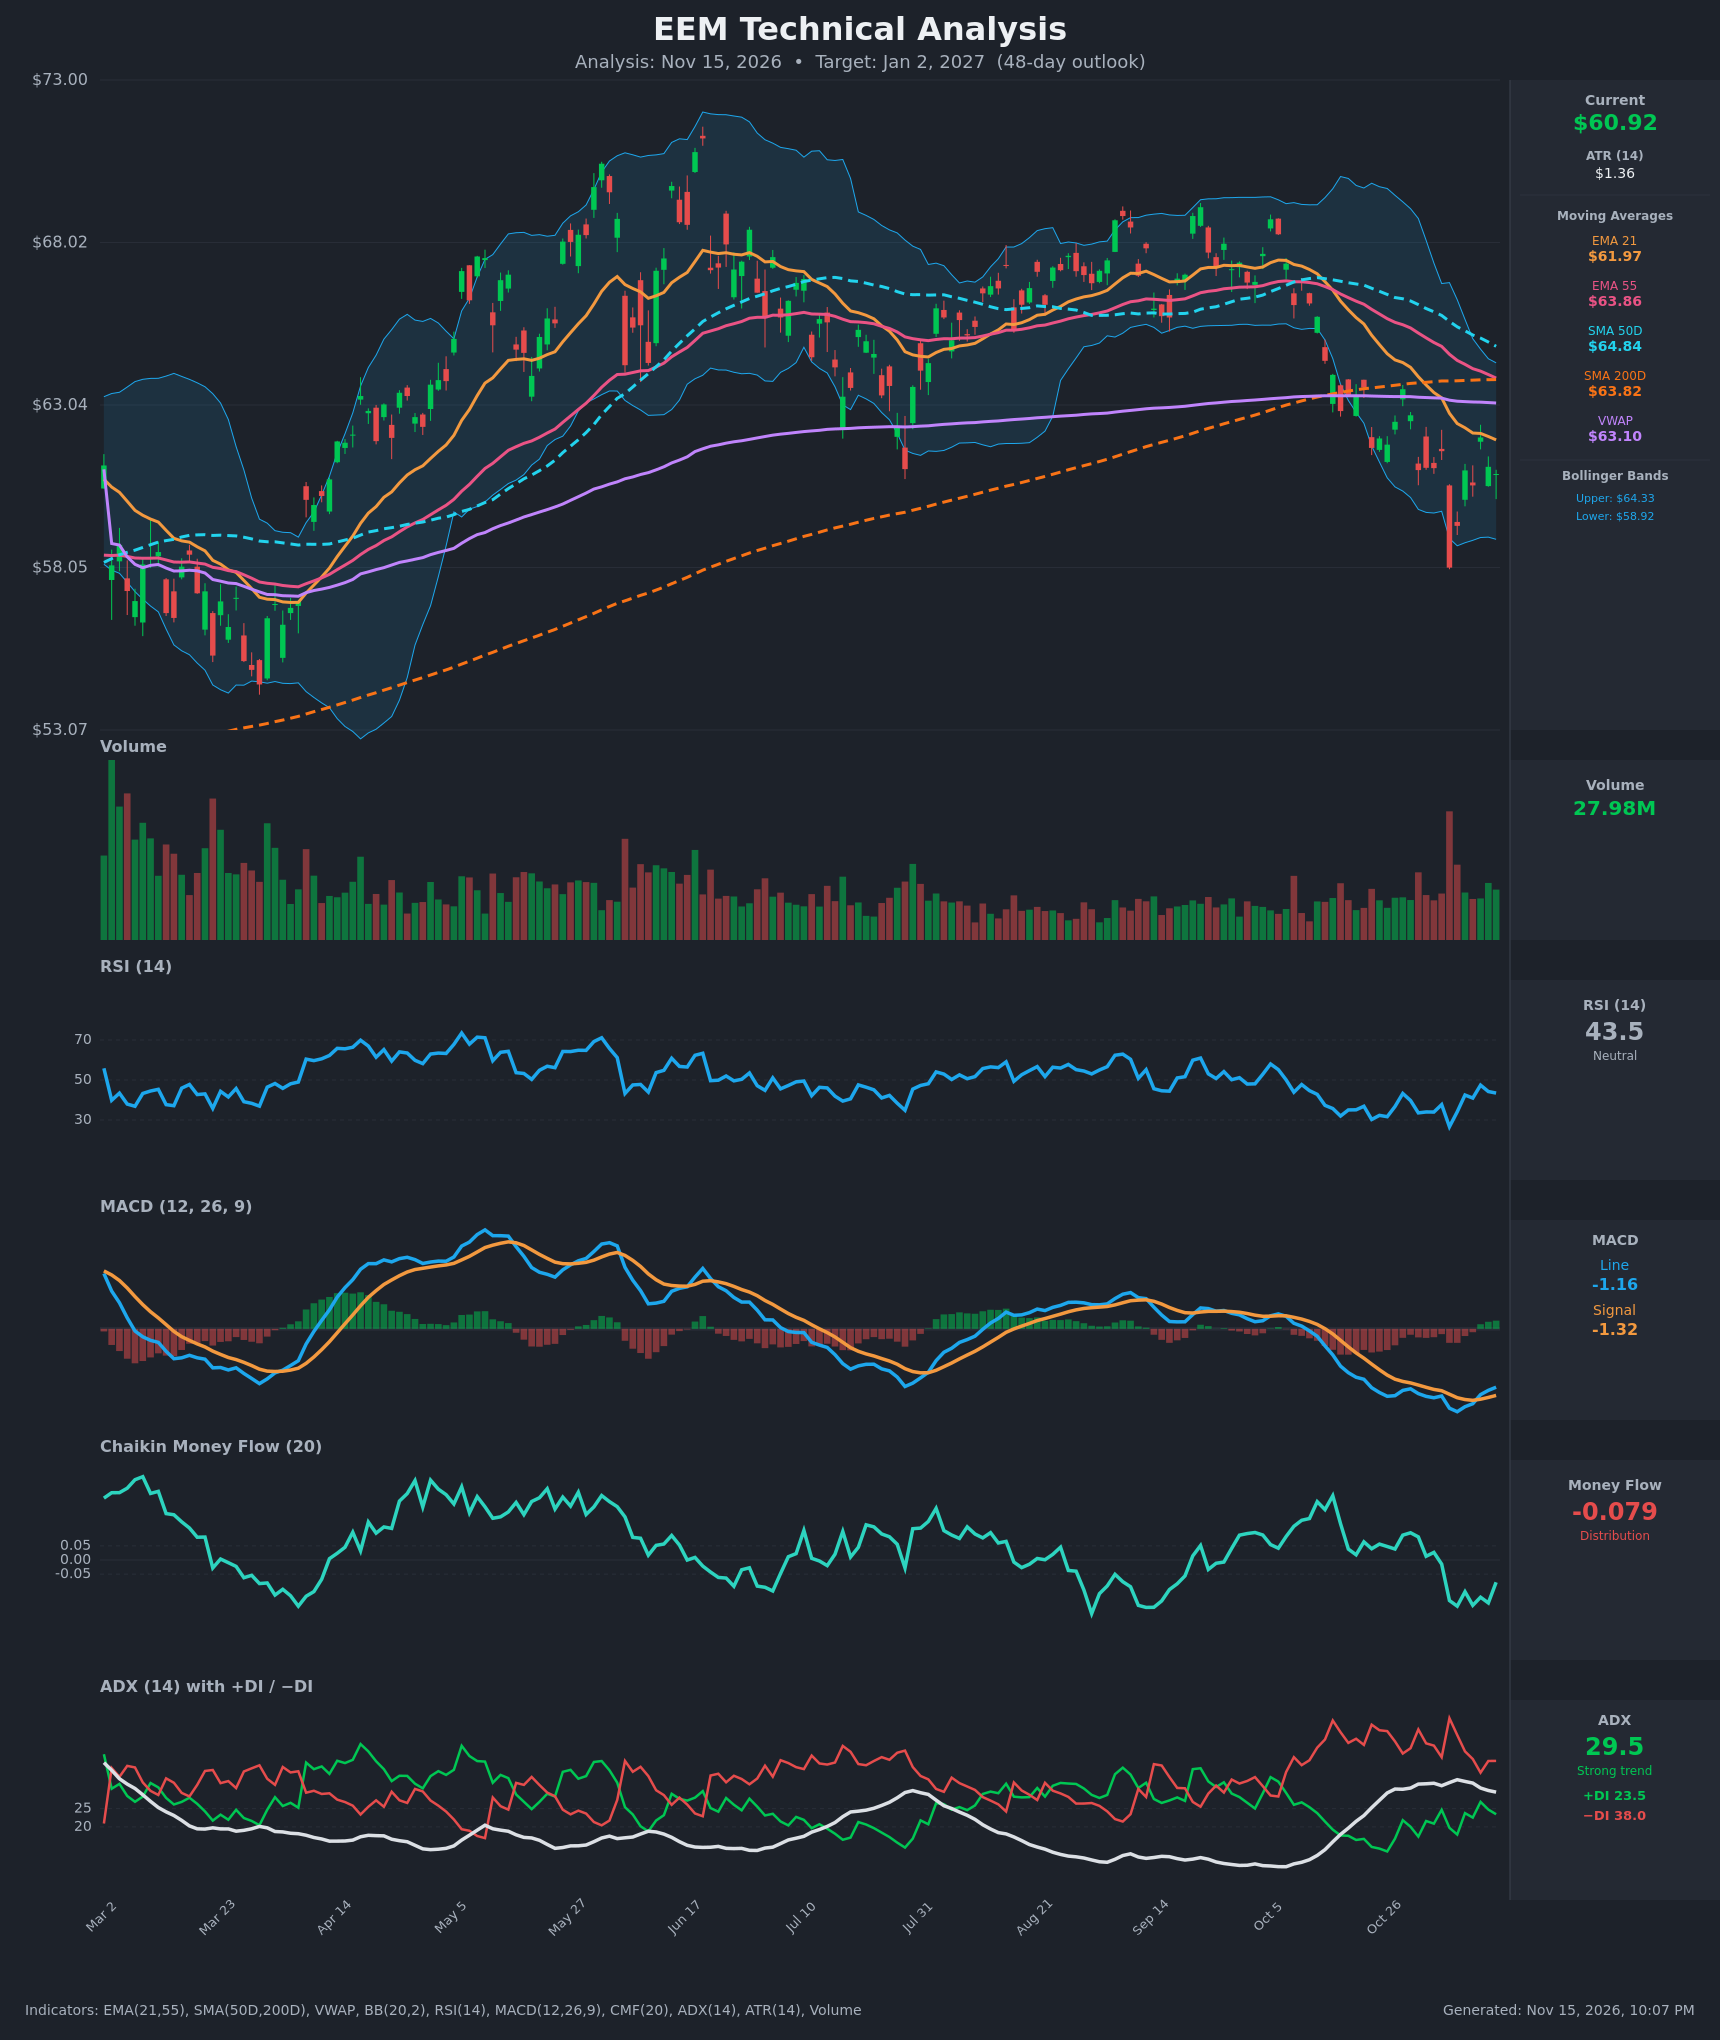
Analysis
TECHNICAL INDICATORS
- RSI (14): 43.5, below the 50 midline but well off the Nov 5 oversold low of 26.6. It has recovered from the oversold zone but remains capped under 50, which is typical of a downtrend bounce. [Bearish]
- 20 EMA (EMA 21): $61.97, with price at $60.92 below it, so it acts as resistance. EMA 21 is also well below EMA 55 ($63.86), and the bearish EMA cross has been in place for weeks. Price has been rejected at the EMA 21 on each bounce (Nov 11 close $62.04 vs EMA $62.16). [Bearish]
- MACD: Line -1.159 is above signal -1.322, and the histogram has turned slightly positive (+0.16) and is rising. This bullish crossover occurred on Nov 11, but both lines are still deep below zero, so it reads as a relief bounce inside a downtrend rather than a trend reversal. [Neutral]
- Bollinger Bands (20): Upper $64.33, lower $58.92, midline about $61.6. Price sits in the lower half after the Nov 5 wick to the lower band ($58.05 close, below the band). Bands are wide, showing elevated volatility, and the failure to reclaim the midline is a mild negative. [Bearish]
- CMF (20): -0.079, below the -0.05 threshold. It has been negative since Nov 4 (-0.015 → -0.163 → -0.079), indicating distribution, though it is ticking up off the low. [Distribution]
- ADX (14): 29.5, above 25, so the trend is strong, though ADX is easing from 32.9. −DI (38.0) is well above +DI (23.5), so the bears are in control, and the DI spread has narrowed from the Nov 5 extreme. [Strong Trend – Bearish]
- Volume: 27.98M on the latest bar, roughly in line with the recent average. The Nov 5 breakdown candle had the heaviest volume of the period, confirming selling conviction. Bounce volume since then has been unremarkable. [Bearish – heavy volume on the selloff, tepid on the bounce]
DIVERGENCES & TRENDS
- Moving averages: Price is below EMA 21, EMA 55, SMA 50 ($64.84), SMA 200 ($63.82) and VWAP ($63.10). That is a fully bearish stack. SMA 50 is falling (66.43 → 64.84 in 15 bars) and converging on SMA 200. A death cross (SMA 50 below SMA 200) looks likely within the next 1–3 weeks if price stays weak.
- Price broke below the SMA 200 in late October and has failed to reclaim it, so long-term trend support has become resistance.
- MACD: The bullish crossover on Nov 11 came while price made no meaningful higher high. Price is only +0.9% above the Nov 6 close, and the MACD line is still near its lows. This is a short-term momentum relief signal, not a trend change.
- RSI: The oversold reading on Nov 5 (26.6) was followed by a bounce to 47.4 that failed below 50. There is no clear bullish divergence, since price has not made a lower low with a higher RSI low beyond the Nov 5 flush.
- CMF: It has stayed negative as price bounced, a mild bearish divergence between money flow and the price recovery.
- ADX/DI: −DI has been above +DI throughout the recent period, with no bullish DI crossover. +DI is attempting to rise (13 → 26.8 → 23.5) but failed to cross.
CHART PATTERNS
- Bearish Triple/Double Top (larger structure): Price made repeated highs near $69–70 (Jun–Sep) and failed. The break of the $65–66 range lows in October confirmed the reversal. The measured move from the top (~$70) to the neckline (~$65) projects to about $60–61, which price has already reached, so the extended target sits near $58–59.
- Possible Bearish Flag/Pennant (short term): The post-Nov 5 bounce between $58 and $62 is a small, low-conviction consolidation under the falling EMA 21. A breakdown below $58.05 would project toward $55–56.
- Support/resistance structure: The Mar–Apr base near $57–58 and the Nov 5 low at $58.05 form a key support zone. A break would open the $55–56 area.
POTENTIAL SCENARIOS
- Scenario 1: Bearish Trend Continuation — Price stays below the falling EMA 21 and SMA 200, a death cross forms, and sellers retest and break the $58 base. Trigger: a daily close below $58.05, or rejection at $62–62.5. Target: $56.00–$59.00, with a possible extension to $55.50. Invalidation: a daily close above $64.00 (SMA 200/upper Bollinger Band area). (50% probability)
- Scenario 2: Bullish Relief Rally / Mean Reversion — The MACD crossover and the oversold bounce extend into a rally toward the moving average cluster. Trigger: a close above $62.00 (EMA 21) on rising volume with CMF turning positive. Target: $63.80–$64.80 (SMA 200/SMA 50). Invalidation: a close back below $59.50. (28% probability)
- Scenario 3: Neutral Range Consolidation — Price chops between $58 and $62.5 as volatility compresses and ADX fades. Trigger: failure to break either $58.05 or $62.00. Target: $59.00–$62.00. Invalidation: a close outside the $58–$63 range. (22% probability)
PRICE TARGETS
- Target Price: $59.20 (48 days, around Jan 2, 2027)
- Expected Range: $55.80 to $64.80 (width $9.00 ≈ 14.8% of current price, consistent with the 30–60 day guidance of 12–18%)
- Key Levels: Support at $58.05, Resistance at $61.97 (next resistance at $63.82 SMA 200)
OVERALL BIAS
OVERALL BIAS: BEARISH - Price is below every major moving average and VWAP, with −DI dominating at ADX 29.5, CMF in distribution, and a likely death cross ahead. The MACD crossover and RSI bounce offer only a relief-rally risk toward $62–$64 inside the downtrend.
This is educational analysis and not financial advice.