EEM 6-day bearish forecast — Nov 1, 2026
- Bias: Bearish
- Timeframe: 6 days (made Nov 1, 2026, target date Nov 6, 2026)
- Price at analysis: $61.03
- Price target: $60.60
- Expected range: $59.45 – $62.15
- Result: Correct (-2.7%) — closed at $59.40 on Nov 6, 2026; quality score 99/100
Get a free AI analysis of EEM today
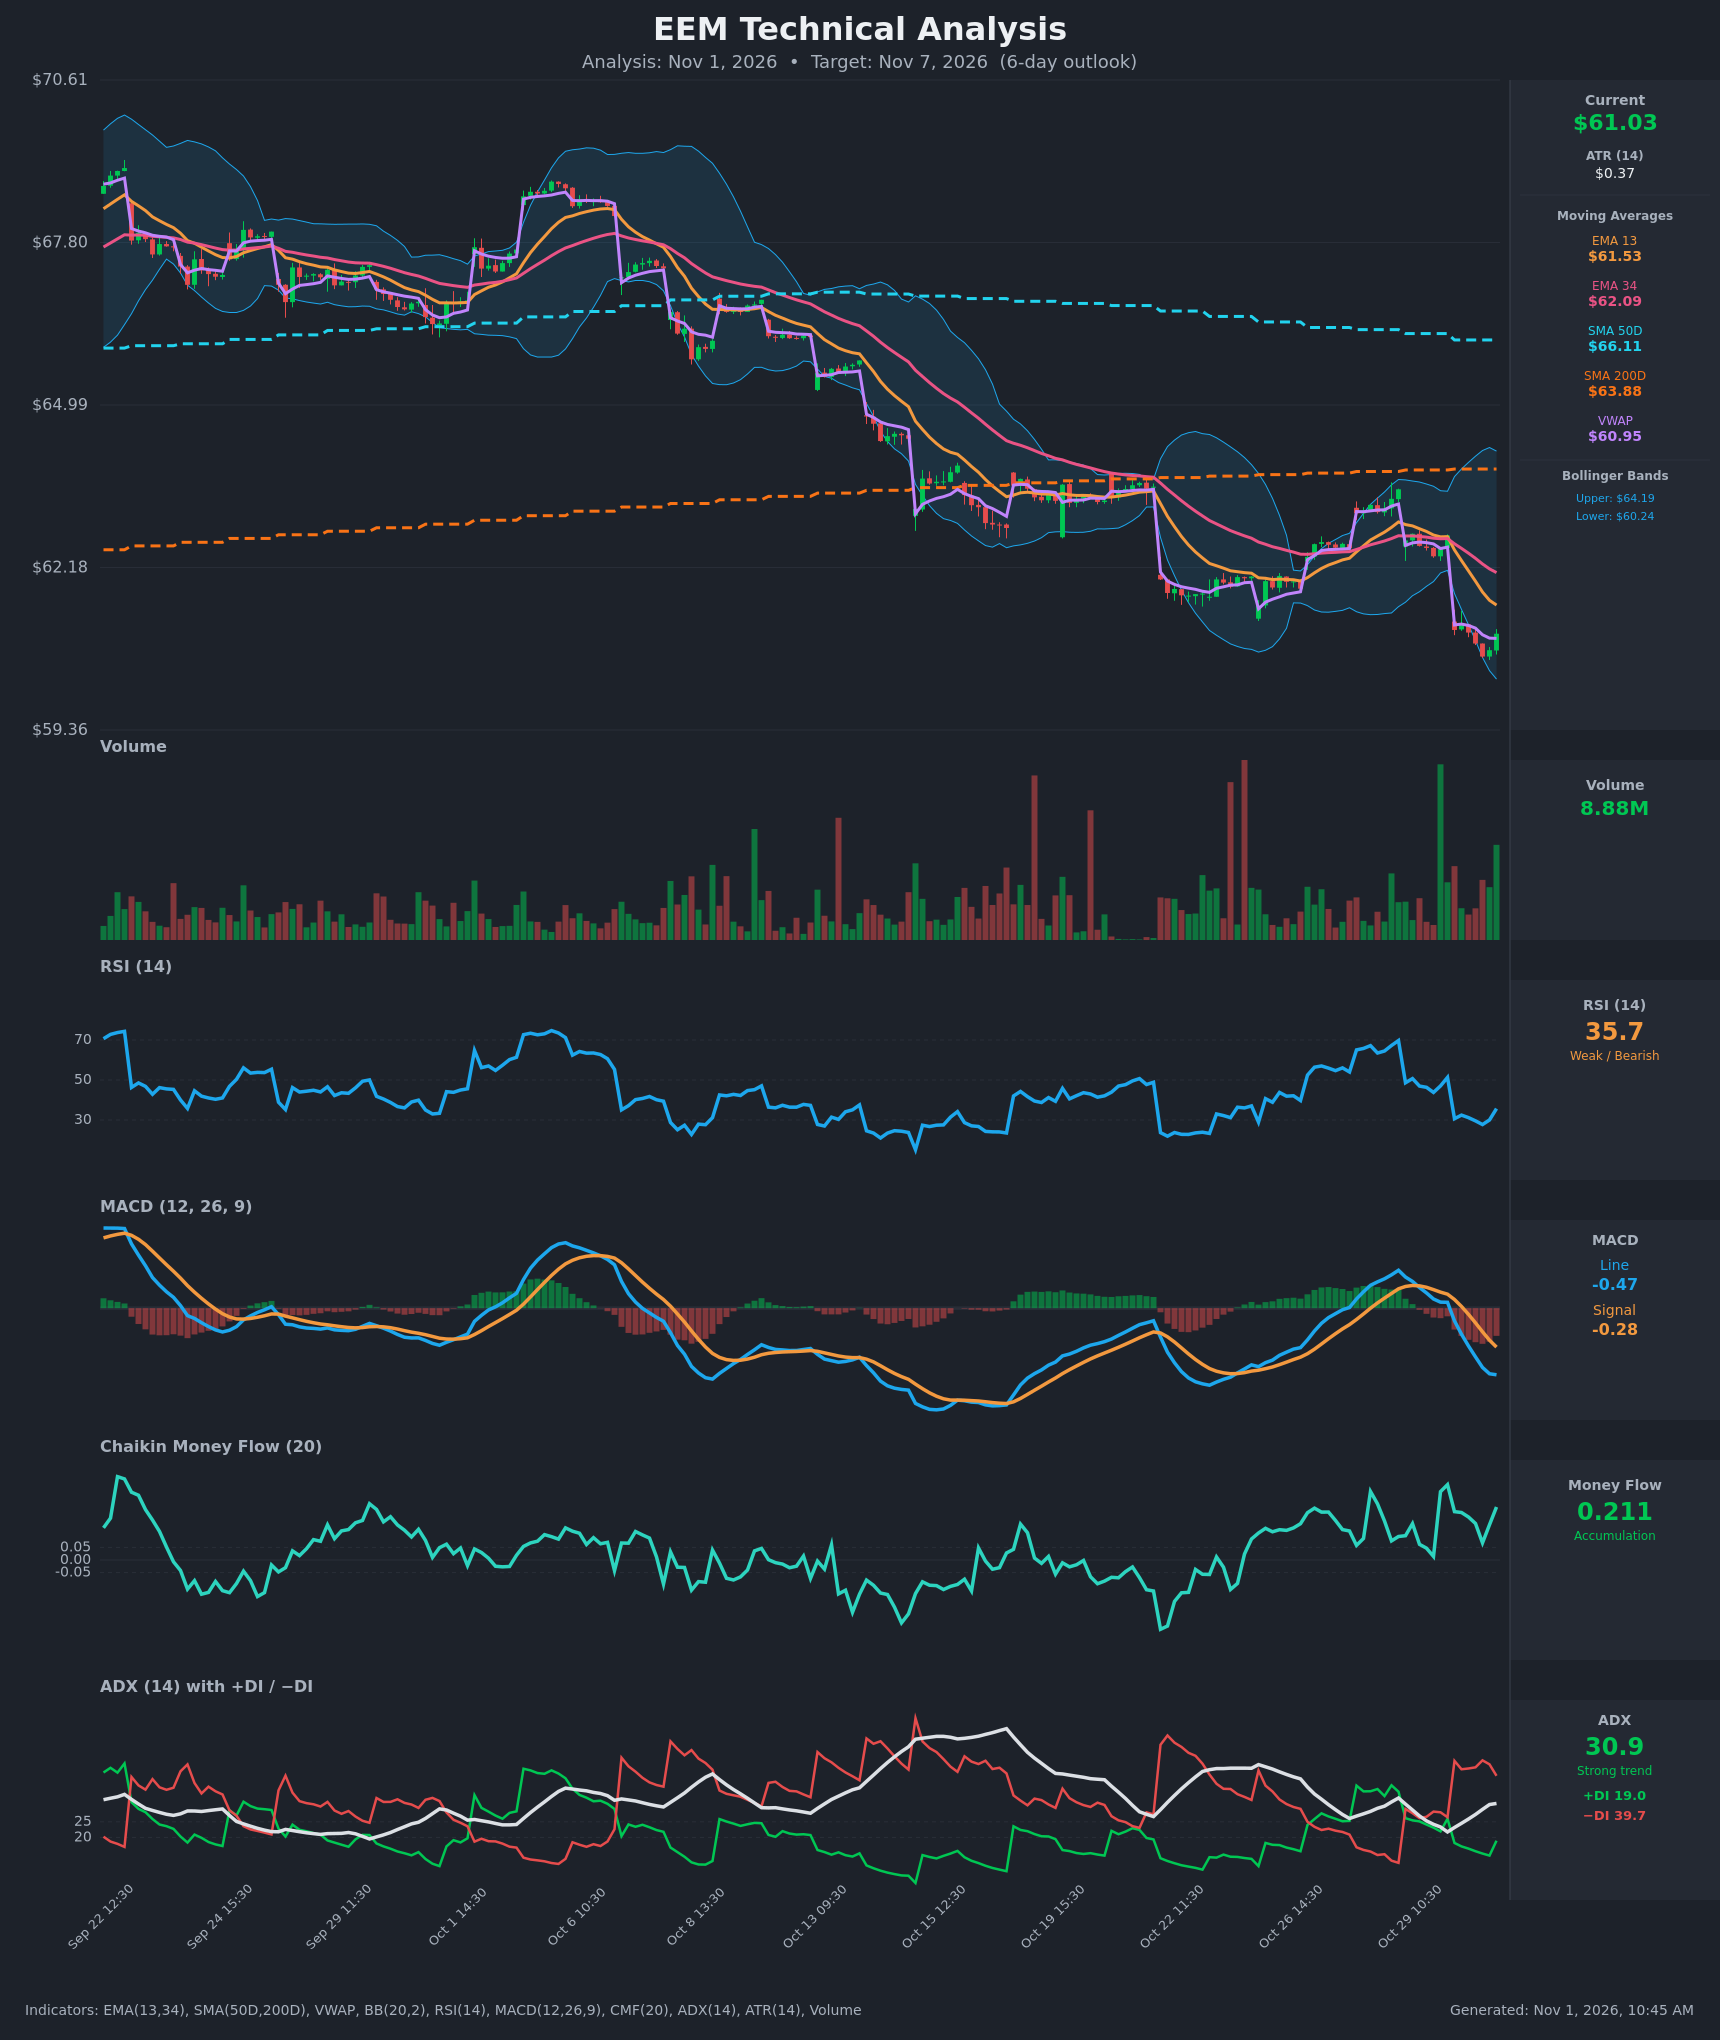
Analysis
TECHNICAL INDICATORS
- RSI (14): 35.69, recovering from 27.7 on Oct 30 13:30 but still below 40 and in bearish territory. Momentum is bouncing from near-oversold levels without having turned bullish. [Bearish]
- 20 EMA (EMA 13 / EMA 34 used): EMA 13 is $61.53 and EMA 34 is $62.09, with price at $61.03 below both. EMA 13 is below EMA 34 after a bearish cross on Oct 30. Both are sloping down and act as overhead resistance. [Bearish]
- MACD: Line -0.472 is below signal -0.276 and both are falling. The bearish cross happened on Oct 30 and the histogram is negative and widening, though the line's decline is slowing (-0.465 to -0.472). [Bearish]
- Bollinger Bands (20): Upper $64.19, lower $60.24. Price at $61.03 sits in the lower quarter of the bands, just above the lower band after tagging the area near it. The bands are wide, which shows elevated volatility. The lower band could give a bounce, but a walk along it is possible in a strong trend. [Bearish]
- CMF (20): 0.211, well above +0.05 and a bullish divergence against price. Buying volume appears to be absorbing the selling near the lows. [Accumulation]
- ADX (14): 30.9, rising from 21.7. −DI at 39.7 is far above +DI at 19.0, so this is a strong, established downtrend. [Strong Trend – Bearish]
- Volume: 8.88M, with the recent bars showing a green volume bar pickup on the bounce. The gap-down on Oct 30 came on elevated volume, which confirms the selling. The latest uptick suggests some dip buying but not capitulation. [Mixed / Slightly Supportive of a Bounce]
DIVERGENCES & TRENDS
- CMF vs price: Price is making lower lows while CMF stays strongly positive (0.21). This is a bullish divergence that points to dip-buying and could support a relief bounce.
- RSI: It made a higher low (~27.7 versus ~24-25 earlier in October) and is turning up from near oversold. This is a mild positive but not confirmed.
- Moving averages: Price is below EMA 13, EMA 34, SMA 200D ($63.88) and SMA 50D ($66.11). The SMA 50D is still above the SMA 200D, so there is no death cross yet, but the gap is narrowing and the 50D is falling. Price is also below VWAP-anchored resistance of about $60.95, so it is only slightly above VWAP.
- MACD / DI: Bearish MACD cross and −DI dominance (39.7 vs 19.0) confirm the downtrend. The gap down on Oct 30 broke the Oct 22-29 consolidation.
- Price has been stair-stepping lower through gap-downs (Oct 22, Oct 30) with weak recoveries.
CHART PATTERNS
- Bearish continuation / downtrend structure: The chart shows a series of lower highs and lower lows with gap-downs. The Oct 23-29 sideways drift between about $62.3 and $63.5 resembles a Bearish Flag/Pennant (continuation). It broke down on Oct 30 and has an implied measured move toward about $60 or slightly below.
- Price near the lower Bollinger Band with positive CMF hints at a possible short-term base, similar to a Bullish Falling Wedge on a very small scale. Nothing is confirmed, so a bounce would be corrective inside the downtrend.
- Implied targets: downside toward $60.00 and then $59.50, and a relief bounce toward the EMA 13 at $61.50 and EMA 34 at $62.09.
POTENTIAL SCENARIOS
- Scenario 1: Bearish Trend Continuation — The downtrend resumes after a brief bounce fails at the EMA 13 / VWAP area, in line with the strong ADX and −DI dominance. Trigger: rejection near $61.50-$62.00 or a break below $60.60. Target: $60.00, with an extension to $59.60. Invalidation: daily close above $62.10 (EMA 34). (50% probability)
- Scenario 2: Bullish Relief Bounce — The CMF divergence and RSI turning up from near oversold fuel a mean-reversion bounce toward the EMAs. Trigger: hold above $60.60 and a push through $61.55. Target: $62.00-$62.30. Invalidation: break below $60.25. (32% probability)
- Scenario 3: Neutral Choppy Base — Price consolidates near the lower band between $60.40 and $61.80 while indicators reset. Trigger: low-volume drift with ADX flattening. Target: $61.00 area. Invalidation: close outside $60.20-$62.10. (18% probability)
PRICE TARGETS
- Target Price: $60.60 (6-day horizon)
- Expected Range: $59.45 to $62.15 (width $2.70, about 4.4% of the current price, which is on the low side for 6 days, though ATR is only $0.37 and the range holds roughly 3 ATR either side)
- Key Levels: Support at $60.24 (lower Bollinger Band), Resistance at $61.53 (EMA 13), with further resistance at $62.09 (EMA 34)
Self-check: width = $62.15 − $59.45 = $2.70, or 4.4% of $61.03. That fits the 4-8% guidance for a 6-day horizon, near the low end given low ATR volatility. It is wider than a 2-3 day range would be.
OVERALL BIAS
OVERALL BIAS: BEARISH - Strong ADX (30.9) with −DI (39.7) far above +DI (19.0), a bearish MACD cross, price below all key moving averages and an EMA 13/34 bearish cross favor continuation lower. The positive CMF and near-oversold RSI argue for a bounce along the way, which caps the downside target at modest levels.
This is educational analysis and not financial advice.