NIO 4-day bearish forecast — Nov 1, 2026
- Bias: Bearish
- Timeframe: 4 days (made Nov 1, 2026, target date Nov 4, 2026)
- Price at analysis: $3.20
- Price target: $3.16
- Expected range: $3.12 – $3.27
- Result: Incorrect (+3.1%) — closed at $3.30 on Nov 4, 2026; quality score 23/100
Get a free AI analysis of NIO today
Analysis
TECHNICAL INDICATORS
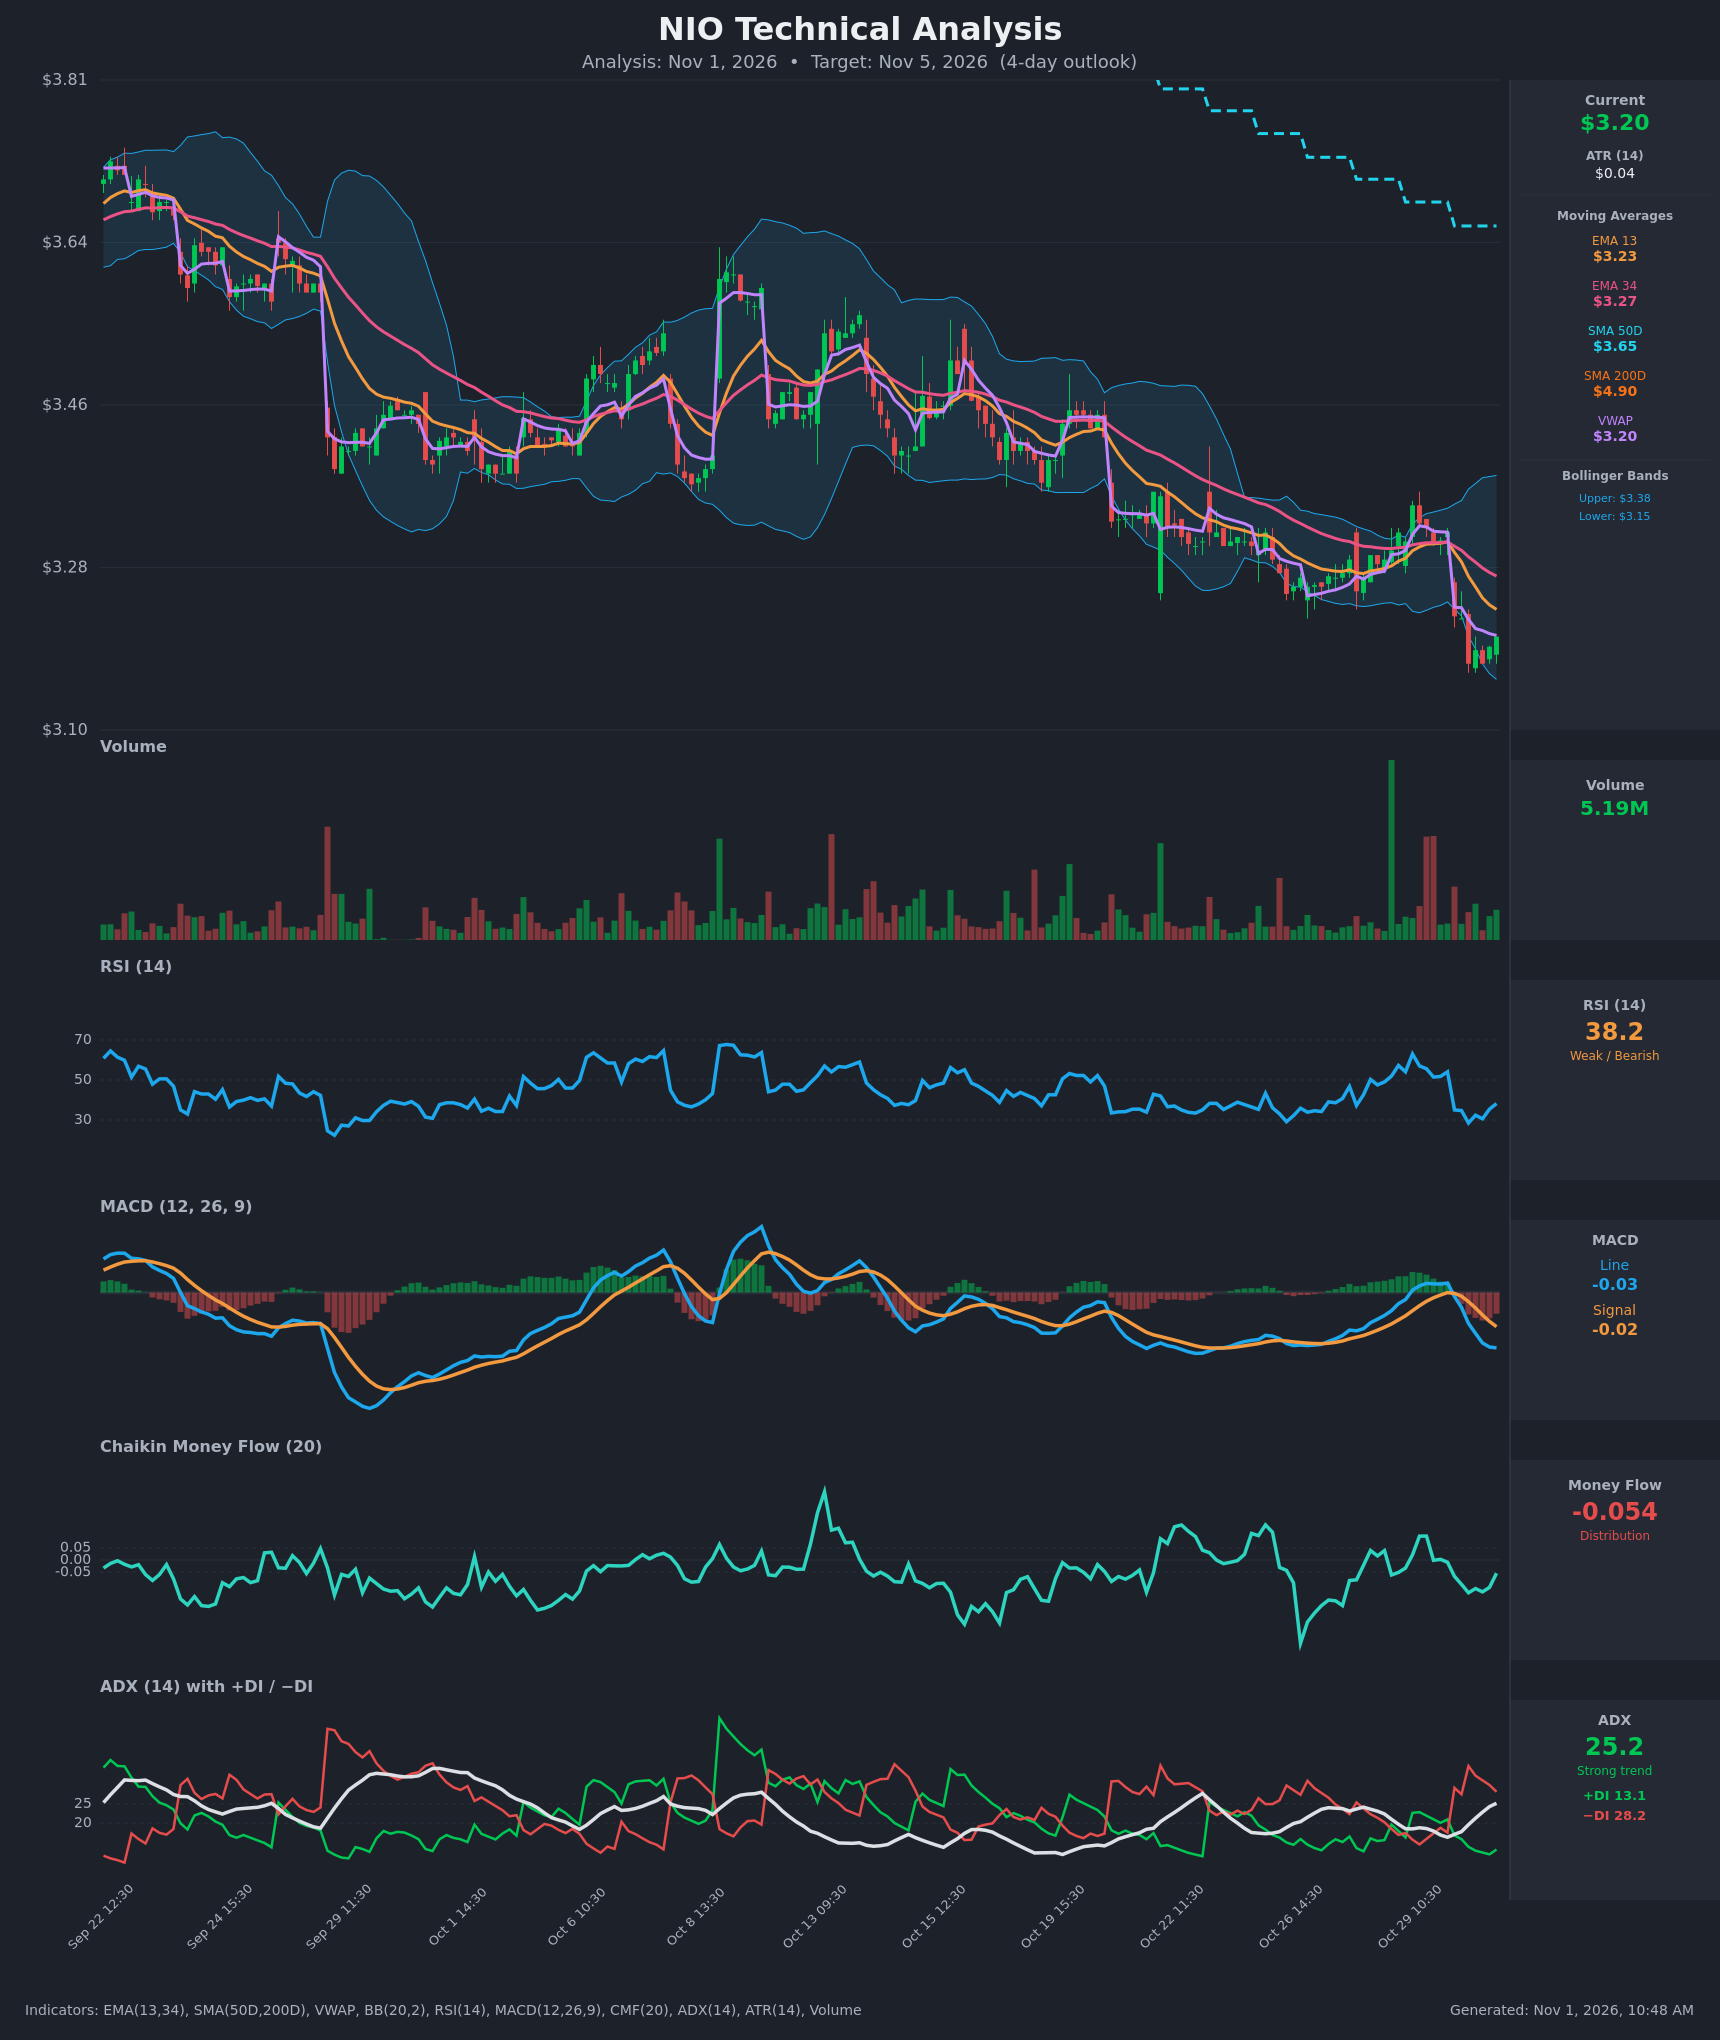
- RSI (14): 38.22. It bounced from an intraday low near 28.5 on Oct 30 but remains below 50 and in bearish territory. It is not yet oversold, so there is room for further downside. [Bearish]
- 20 EMA: The data provides EMA 13 at $3.23 and EMA 34 at $3.27, and price at $3.20 is below both. EMA 13 is below EMA 34 and both are sloping down, so these act as overhead resistance. [Bearish]
- MACD: The line is -0.0288, below the signal at -0.0177, so the histogram is negative and widening. The bearish crossover occurred on Oct 30 morning and the gap is expanding. [Bearish]
- Bollinger Bands (20): Upper $3.378, lower $3.153, midline about $3.265. Price sits in the lower third, about $0.05 above the lower band. The bands have contracted and are tilting down, with price walking the lower half. A bounce toward the midline is possible, but the band-walk favors continuation. [Bearish]
- CMF (20): -0.054, just below the -0.05 threshold. It slipped from positive readings on Oct 29 and shows mild but persistent distribution. [Distribution]
- ADX (14): 25.2 and rising from 16-17, with -DI at 28.2 well above +DI at 13.1. A new bearish trend is gaining strength. [Strong Trend – Bearish]
- Volume: 5.19M, moderate. There were heavier red bars during the Oct 30 sell-off and no capitulation spike, so there is no sign of a washout bottom. [Neutral to mildly Bearish]
DIVERGENCES & TRENDS
- There is no clear bullish divergence. RSI's recent low of about 28.5 was not accompanied by a meaningful higher low in price, and price made a fresh low near $3.17.
- Price is below EMA 13 (3.23), EMA 34 (3.27), SMA 50D (3.65) and SMA 200D (4.90). The 50D is well below the 200D, so a death cross is already in place, which is a long-term bearish structure.
- On Oct 30 the MACD crossed below its signal, the DI lines flipped to −DI dominance, and price gapped from $3.31 to $3.22. ADX is rising through 25, which confirms the trend.
- Price is also below VWAP at about $3.20, which is a marginally bearish sign.
- The only offsetting point is that price is near the lower Bollinger Band with RSI in the high 30s, so a short-term relief bounce is plausible.
CHART PATTERNS
- The Oct 28-29 tight consolidation around $3.31 followed by the sharp breakdown resembles a Bearish Flag/Pennant continuation, which resolved lower.
- The broader structure since late September is a descending channel of lower highs and lower lows, consistent with the reference diagram's bearish continuation setups.
- A Falling Wedge-style bounce is a possible counter-read, but there is no breakout yet, so it is only a minor probability.
- The measured target of the flag points toward the $3.10-$3.15 area, near the lower band and the chart's bottom axis.
POTENTIAL SCENARIOS
- Scenario 1: Bearish Trend Continuation — Sellers keep control as price remains below the EMAs and VWAP, with MACD and DI both bearish. Trigger: a hold below $3.19 and a break of the Oct 30 low near $3.17. Target: $3.12-$3.16. Invalidation: a close above $3.27 (EMA 34). (52% probability)
- Scenario 2: Bullish Relief Bounce — RSI mean-reverts from the high 30s and price retraces toward the EMA cluster and the Bollinger midline. Trigger: a reclaim of $3.23 (EMA 13) on rising volume. Target: $3.26-$3.30. Invalidation: a rejection at $3.23-$3.27 and a drop back below $3.17. (28% probability)
- Scenario 3: Neutral Sideways Chop — Price consolidates just above the lower band between about $3.15 and $3.25. Trigger: ADX flattening and low-volume overlapping candles. Target: $3.18-$3.23. Invalidation: a decisive break of $3.15 or $3.27. (20% probability)
PRICE TARGETS
- Target Price: $3.16 (4-day)
- Expected Range: $3.12 to $3.27 (width $0.15, about 4.7% of current price, scaled between a 2-3 day and a 7-10 day range)
- Key Levels: Support at $3.15 (lower Bollinger Band), Resistance at $3.27 (EMA 34)
OVERALL BIAS
OVERALL BIAS: BEARISH - Price is below all key moving averages with a bearish MACD crossover, −DI dominating +DI while ADX rises above 25, and CMF showing mild distribution. Proximity to the lower Bollinger Band and an RSI near 38 limit the downside, so the move is likely a modest drift lower rather than a collapse.
This is educational analysis and not financial advice.