NIO 6-day bearish forecast — Nov 1, 2026
- Bias: Bearish
- Timeframe: 6 days (made Nov 1, 2026, target date Nov 6, 2026)
- Price at analysis: $3.20
- Price target: $3.12
- Expected range: $3.01 – $3.25
- Result: Incorrect (+5.6%) — closed at $3.38 on Nov 6, 2026; quality score 0/100
Get a free AI analysis of NIO today
Analysis
TECHNICAL INDICATORS
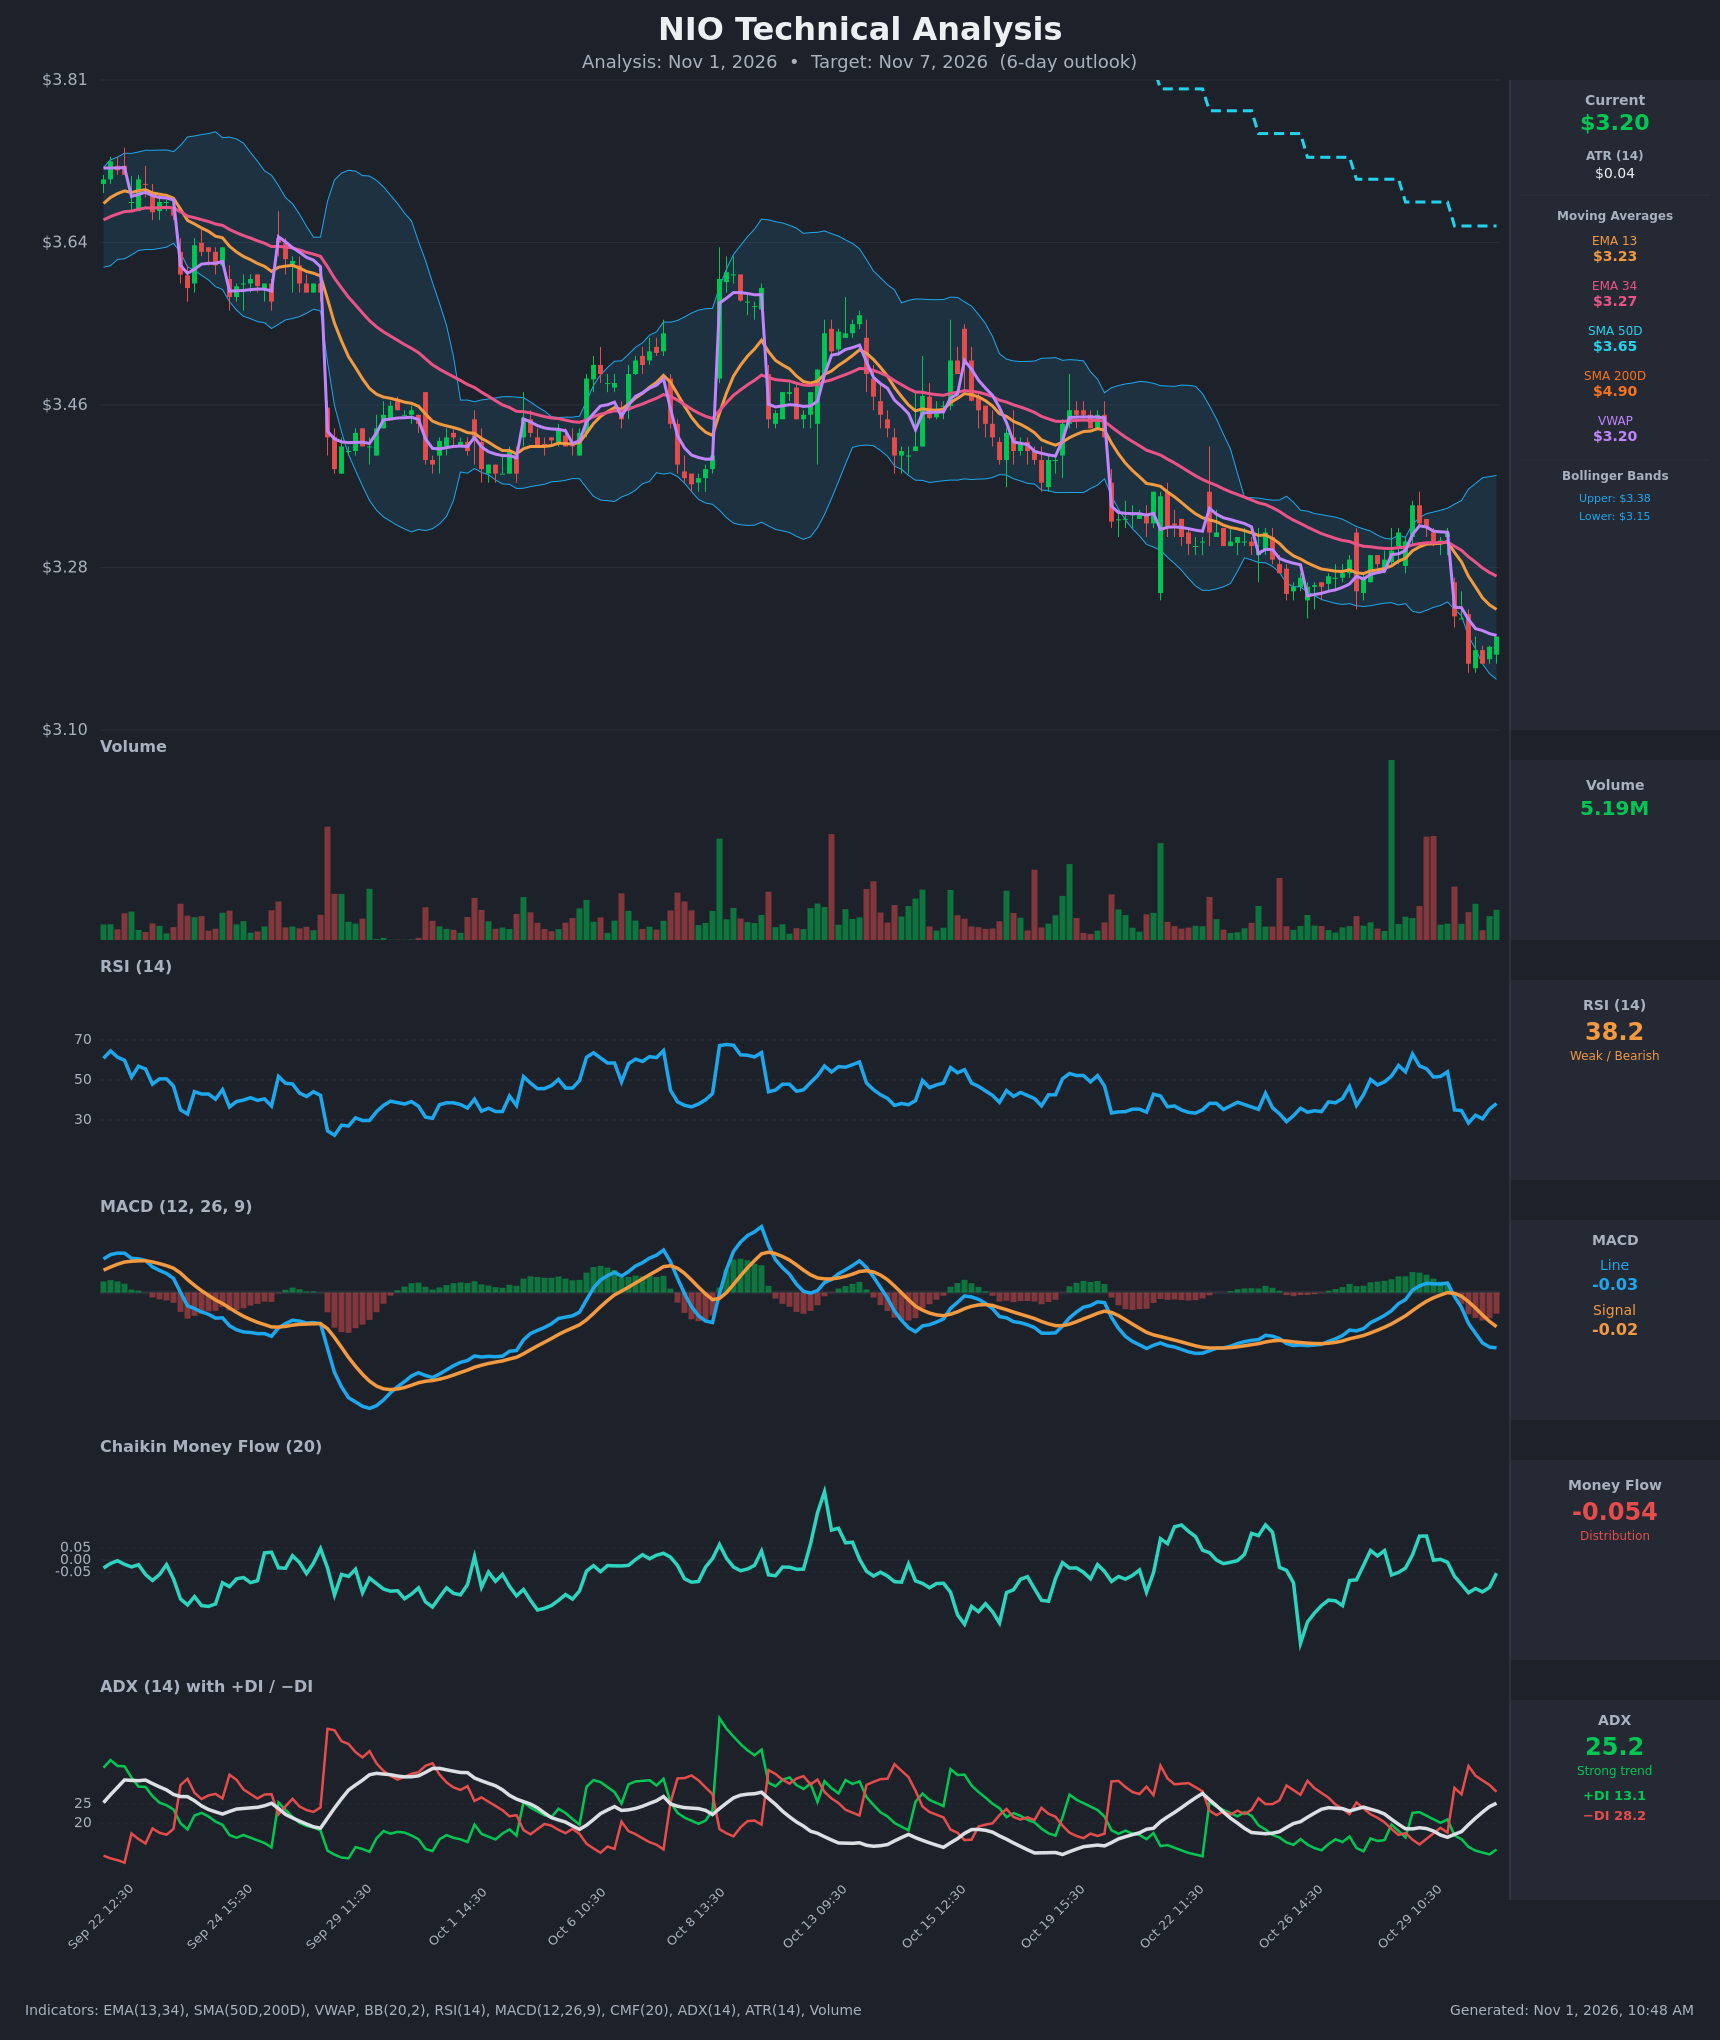
- RSI (14): 38.22, bouncing off a recent low of 28.5 (oversold) on Oct 30 but still below 50. The rebound is modest and has not reclaimed the 40-50 zone, which has capped RSI throughout the downtrend. [Bearish]
- 20 EMA: The supplied values are EMA 13 at $3.23 and EMA 34 at $3.2667. Price at $3.20 is below both, and EMA13 is below EMA34. The EMAs are sloping down and act as overhead resistance. [Bearish]
- MACD: The line is -0.0288 and the signal is -0.0177. The bearish crossover occurred on Oct 30 at 09:30, and the line is still falling below the signal, so the histogram is negative and widening. [Bearish]
- Bollinger Bands (20): Upper $3.378, lower $3.1527. Price at $3.20 sits in the lower quarter of the bands after hugging the lower band. The bands are narrow relative to the earlier range, so volatility is compressed, and a push through the lower band would signal acceleration. [Bearish]
- CMF (20): -0.054, just below the -0.05 threshold. It flipped from positive (+0.098) on Oct 29 to negative on the Oct 30 selloff, which indicates mild distribution. [Distribution]
- ADX (14): 25.2 and rising from 16, so a trend is emerging. −DI at 28.2 is well above +DI at 13.1, so bears are firmly in control. [Strong Trend – Bearish]
- Volume: 5.19M, moderate and in line with recent averages, with no capitulation spike. The Oct 30 gap down came on average volume, and the lack of a volume climax suggests selling may not be exhausted. [Neutral to mildly Bearish]
DIVERGENCES & TRENDS
- No clear bullish RSI divergence. RSI made a higher low (28.5 on Oct 30, against ~25 in late September) while price made lower lows, but the move is too small to confirm a reversal.
- The long-term trend is firmly down. Price ($3.20) is below SMA50D ($3.65) and far below SMA200D ($4.90). SMA50D is well under SMA200D, which means the death cross is already in place.
- EMA13 crossed below EMA34 around Oct 30 and the gap is widening.
- The MACD bearish crossover, the DI flip to −DI > +DI, and the CMF flip below -0.05 all happened on the same Oct 30 gap down.
- VWAP ($3.2012) is almost exactly at price, so price is being pinned right at the session VWAP. A failure to hold above it favors sellers.
- The ADX rise from the teens to 25 confirms that the move is a trend, not just noise.
CHART PATTERNS
- Bearish Pennant/Flag breakdown: Price consolidated in a tight $3.28-$3.35 range on Oct 28-29, then gapped down through support on Oct 30. This resembles the Bearish Pennant continuation pattern in the reference diagram. A measured-move projection points to the low $3.10s, near the lower Bollinger Band and the recent low.
- The broader structure is a descending channel with lower highs and lower lows since mid-October, a staircase pattern of gap-downs followed by weak bounces.
- A Bullish Falling Wedge is possible if price decelerates and breaks above the EMAs, but that is not confirmed and would need a close above ~$3.27.
POTENTIAL SCENARIOS
- Scenario 1: Bearish Trend Continuation — The breakdown from the pennant continues, with price pressing the lower Bollinger Band as −DI stays dominant and ADX rises. Trigger: break and hold below $3.15 (lower BB). Target: $3.08-$3.12. Invalidation: close above $3.27 (EMA34). (55% probability)
- Scenario 2: Bullish Relief Bounce — An oversold bounce from RSI near 30 lifts price back to the EMA13/EMA34 zone before sellers return. Trigger: reclaim of $3.23 (EMA13) with rising volume. Target: $3.27-$3.31. Invalidation: loss of $3.15. (30% probability)
- Scenario 3: Neutral Consolidation — Price chops between the lower band and the EMAs on low volume. Trigger: failure of both breakout and breakdown. Target: $3.15-$3.24. Invalidation: close outside that range. (15% probability)
PRICE TARGETS
- Target Price: $3.12 (6-day)
- Expected Range: $3.01 to $3.25. The width is $0.24, about 7.5% of the current price, which fits the 7-10 day guidance of 4-8% and is wider than a 2-3 day range would be.
- Key Levels: Support at $3.15 (lower Bollinger Band, then the recent low near $3.10), Resistance at $3.27 (EMA34)
OVERALL BIAS
OVERALL BIAS: BEARISH - Price is below every moving average, the MACD has crossed bearish, −DI dominates +DI with ADX rising through 25, and CMF shows distribution after a pennant-style breakdown. Only a reclaim of $3.27 would challenge this view.
This is educational analysis and not financial advice.