SLV 6-day bullish forecast — Nov 1, 2026
- Bias: Bullish
- Timeframe: 6 days (made Nov 1, 2026, target date Nov 6, 2026)
- Price at analysis: $44.57
- Price target: $45.40
- Expected range: $43.30 – $46.40
- Result: Correct (+5.4%) — closed at $46.97 on Nov 6, 2026; quality score 84/100
Get a free AI analysis of SLV today
Analysis
TECHNICAL INDICATORS
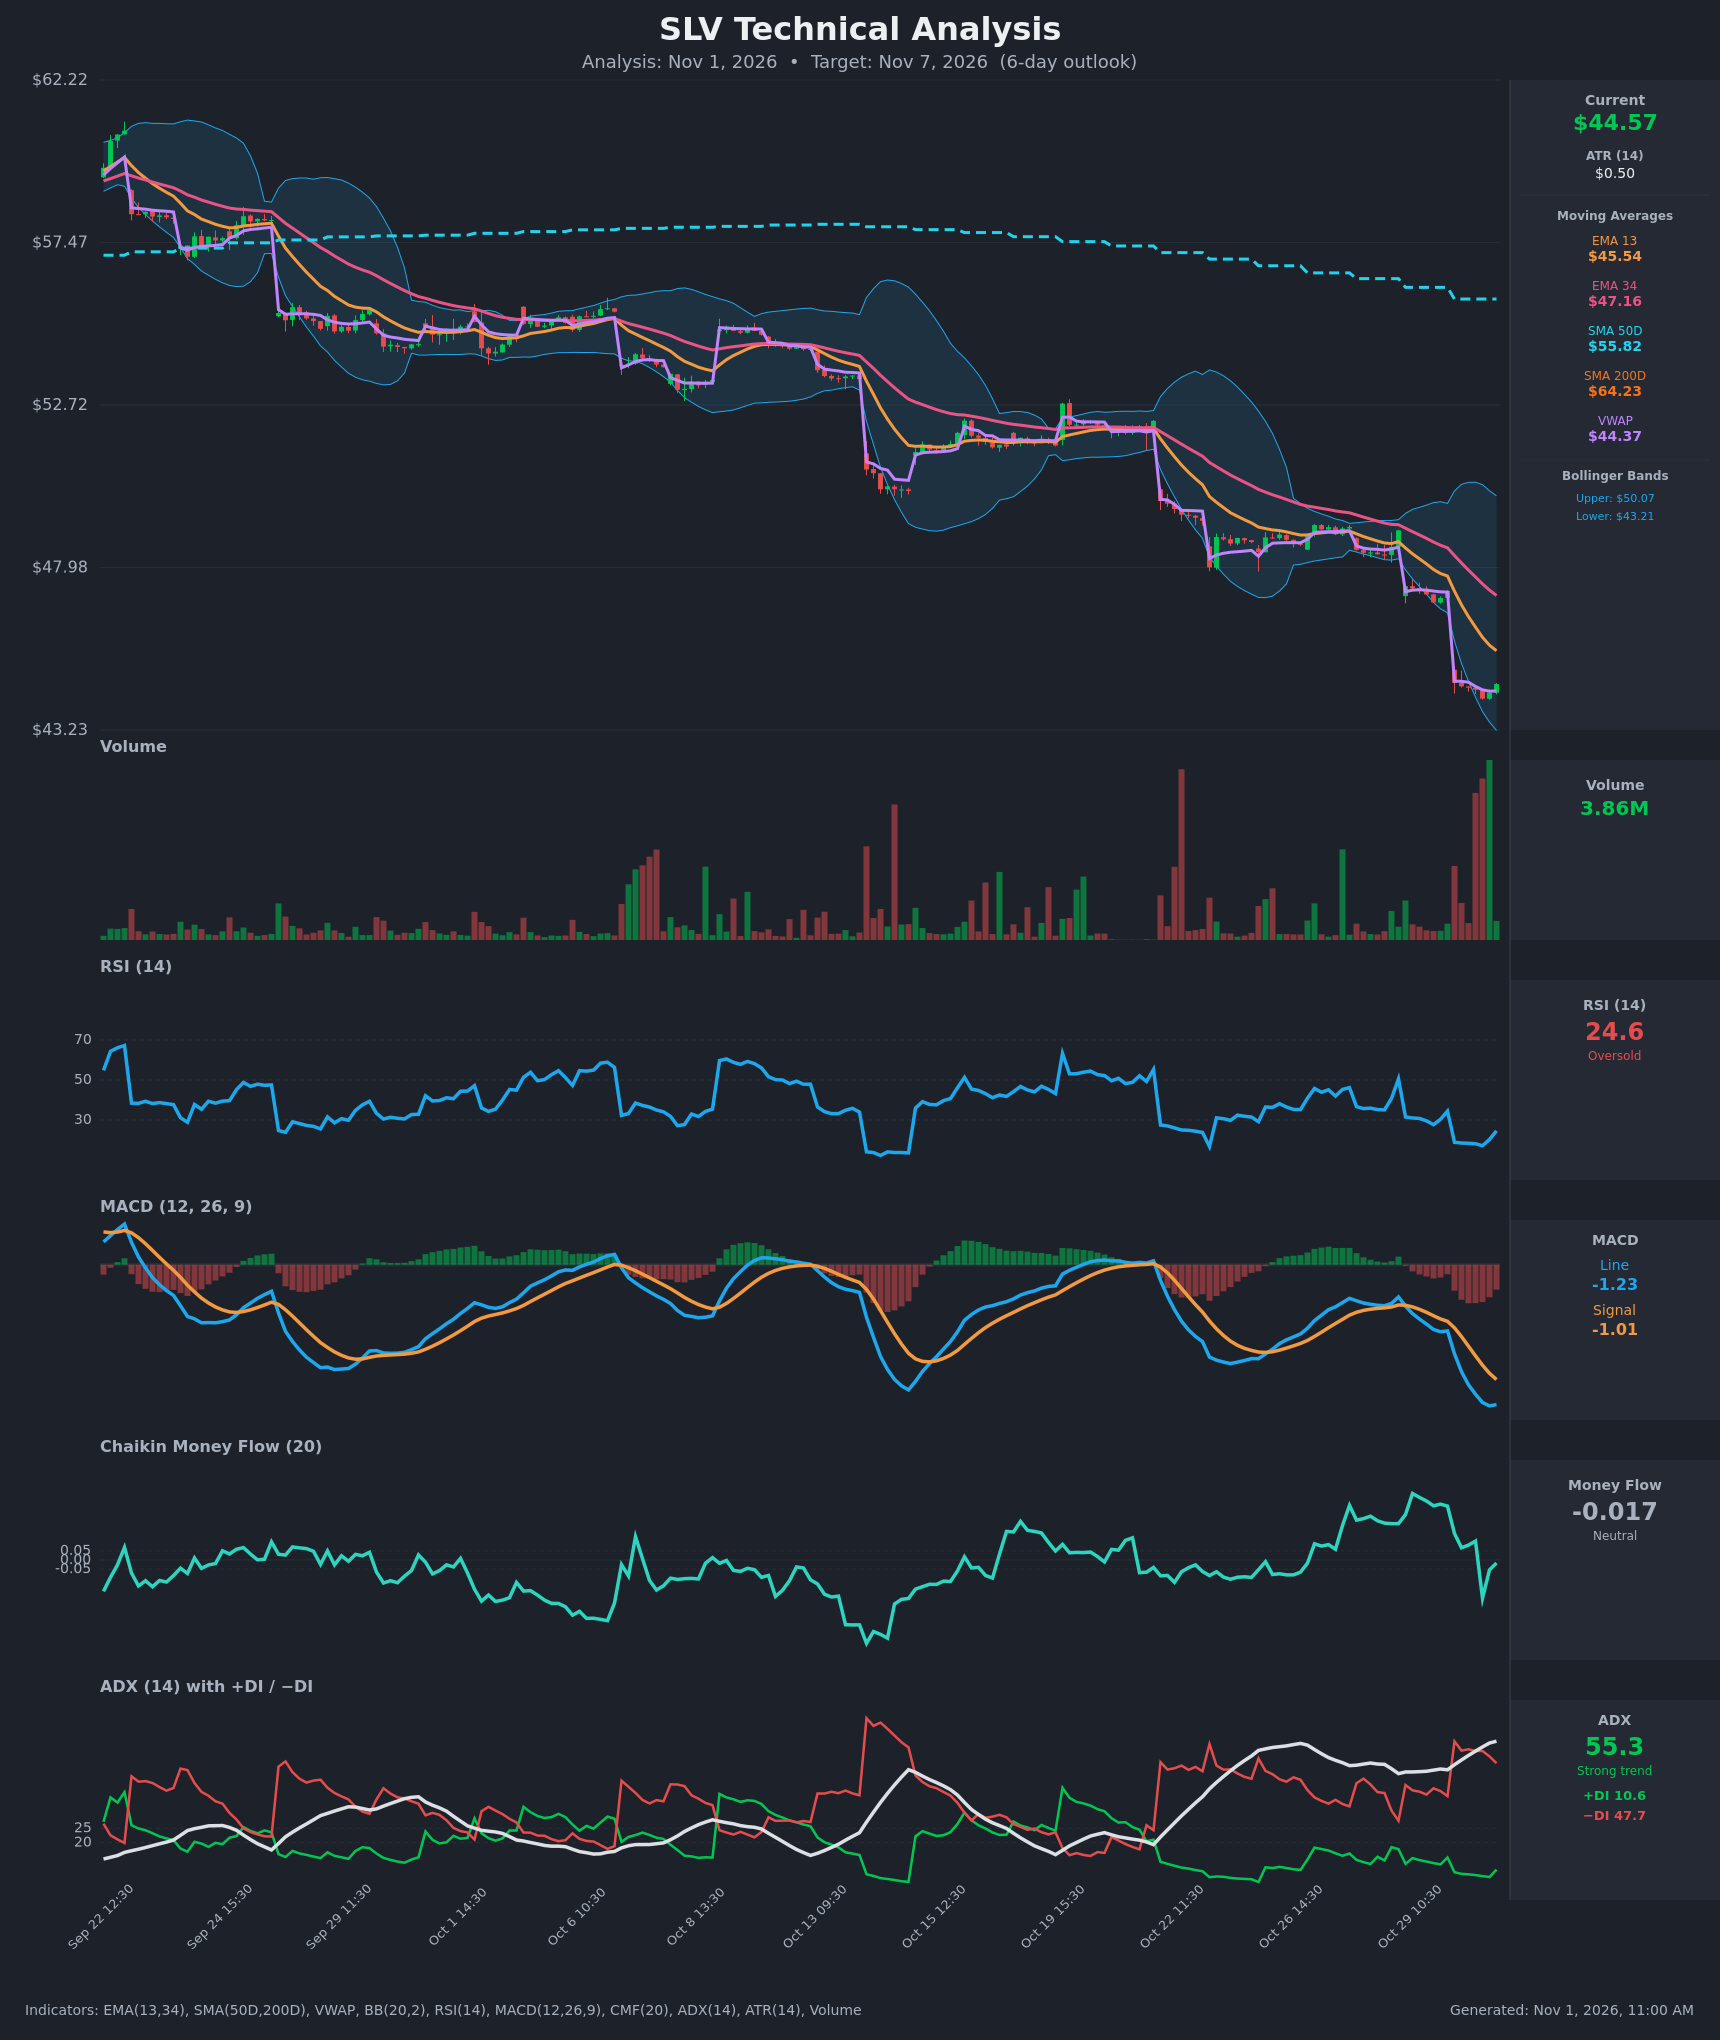
- RSI (14): 24.61, oversold, and bouncing off a recent low of about 17.2. The prior two oversold readings (Oct 15 area and Oct 22) were also followed by relief bounces. Momentum is still deeply weak, but the downside is stretched. [Bullish]
- 20 EMA: The data gives EMA 13 at $45.54 and EMA 34 at $47.16. Price ($44.57) is below both, and both are sloping down. EMA 13 is overhead resistance and the first bounce target. The EMA13 < EMA34 bearish alignment has been in place for weeks. [Bearish]
- MACD: Line -1.23 is below signal -1.01, with a widening negative histogram. The line has just started to flatten (-1.244 to -1.233), which is an early sign of downside momentum fading, but there is no bullish cross yet. [Bearish]
- Bollinger Bands (20): Upper $50.07, lower $43.21, with the bands wide from the volatile selloff. Price sits near the lower band (about 20% of the band width above it) after walking the band down. A bounce toward the midline is likely, but the midline is far above ($46.6). [Neutral]
- CMF (20): -0.017, neutral. It dropped from +0.36 to about -0.2 and is now recovering. There is no clear distribution despite the price collapse, which suggests selling pressure is fading. [Neutral]
- ADX (14): 55.3 and rising, with -DI at 47.7 well above +DI at 10.6. This is a very strong bearish trend. Readings above 50 are historically extreme and often come near exhaustion, although the trend has not yet reversed. [Strong Trend – Bearish]
- Volume: 3.86M, with the highest bars on the chart clustered at the far right. This looks like climactic or capitulation volume, and the latest bar is green. High volume near a low with a stabilizing close is a potential selling-climax signature. [Capitulation / Possible Exhaustion]
DIVERGENCES & TRENDS
- Price made a new low while RSI printed 17.2, then rose to 24.6 on a small upward uptick. There is no clean bullish divergence yet, but momentum is stabilizing.
- The MACD histogram is deepening, so there is no bullish divergence there.
- The long-term structure is fully bearish. Price is below SMA50D ($55.82) and SMA200D ($64.23), SMA50D is below SMA200D (a death cross, long established), and EMA13 is below EMA34.
- The price has been falling in a series of gap-downs, with each rally failing at the EMA13/EMA34 area.
- Price is slightly above VWAP ($44.37), the first sign of buyers defending the current area.
- No MACD or EMA bullish crossover has occurred.
CHART PATTERNS
- There is no clean textbook pattern. The structure is a steep, stair-stepping downtrend (a bearish continuation structure). Since Oct 29 there has been a tiny sideways pause near $44.1–$44.6 that could be read as a small bearish flag or a base.
- The nearest reference pattern is a Bullish Falling Wedge, but it is not confirmed. It would require a break above the descending resistance and EMA13 (~$45.5).
- Bearish flag measured-move risk points toward $43.0 and below if $43.2 fails.
- Bounce targets: EMA13 at $45.54, then the gap-fill zone near $46.5–$47.0.
POTENTIAL SCENARIOS
- Scenario 1: Bullish Oversold Relief Bounce — RSI near 25, a volume climax and price stabilizing above VWAP set up a mean-reversion rally toward the EMA13. Trigger: a close above $45.00 with RSI back above 30. Target: $45.40–$46.40 (EMA13, then the area near the Bollinger midline). Invalidation: a close below $43.90. (45% probability)
- Scenario 2: Bearish Trend Continuation — ADX 55 with -DI dominant and a falling MACD means the trend can continue with further gap-downs. Trigger: a break below $44.10 and the lower Bollinger Band at $43.21. Target: $42.30–$43.00. Invalidation: a close above $45.55 (EMA13). (40% probability)
- Scenario 3: Neutral Basing Chop — Price consolidates between $43.80 and $45.50 as momentum resets. Trigger: low-volume, overlapping candles. Target: about $44.50. Invalidation: a break of either boundary on volume. (15% probability)
PRICE TARGETS
- Target Price: $45.40 (6-day horizon)
- Expected Range: $43.30 to $46.40 (width $3.10, about 7.0% of the current price, consistent with the 7–10 day band scaled down for 6 days)
- Key Levels: Support at $43.21 (lower Bollinger Band), Resistance at $45.54 (EMA 13)
OVERALL BIAS
OVERALL BIAS: BULLISH - The weight of the evidence favors a relief bounce: RSI is deeply oversold and turning up, there is climactic volume with a green final bar, price is holding above VWAP, and ADX above 50 suggests the selling is exhausted. The bounce is modest, and the dominant downtrend (MACD still negative, price below all moving averages) caps upside near $45.5–$46.5, so conviction is moderate.
This is educational analysis and not financial advice.