SLV 83-day bearish forecast — Nov 15, 2026
- Bias: Bearish
- Timeframe: 83 days (made Nov 15, 2026, target date Feb 5, 2027)
- Price at analysis: $44.13
- Price target: $40.50
- Expected range: $35.00 – $46.50
- Result: Pending — graded after the close on Feb 5, 2027
Get a free AI analysis of SLV today
Analysis
TECHNICAL INDICATORS
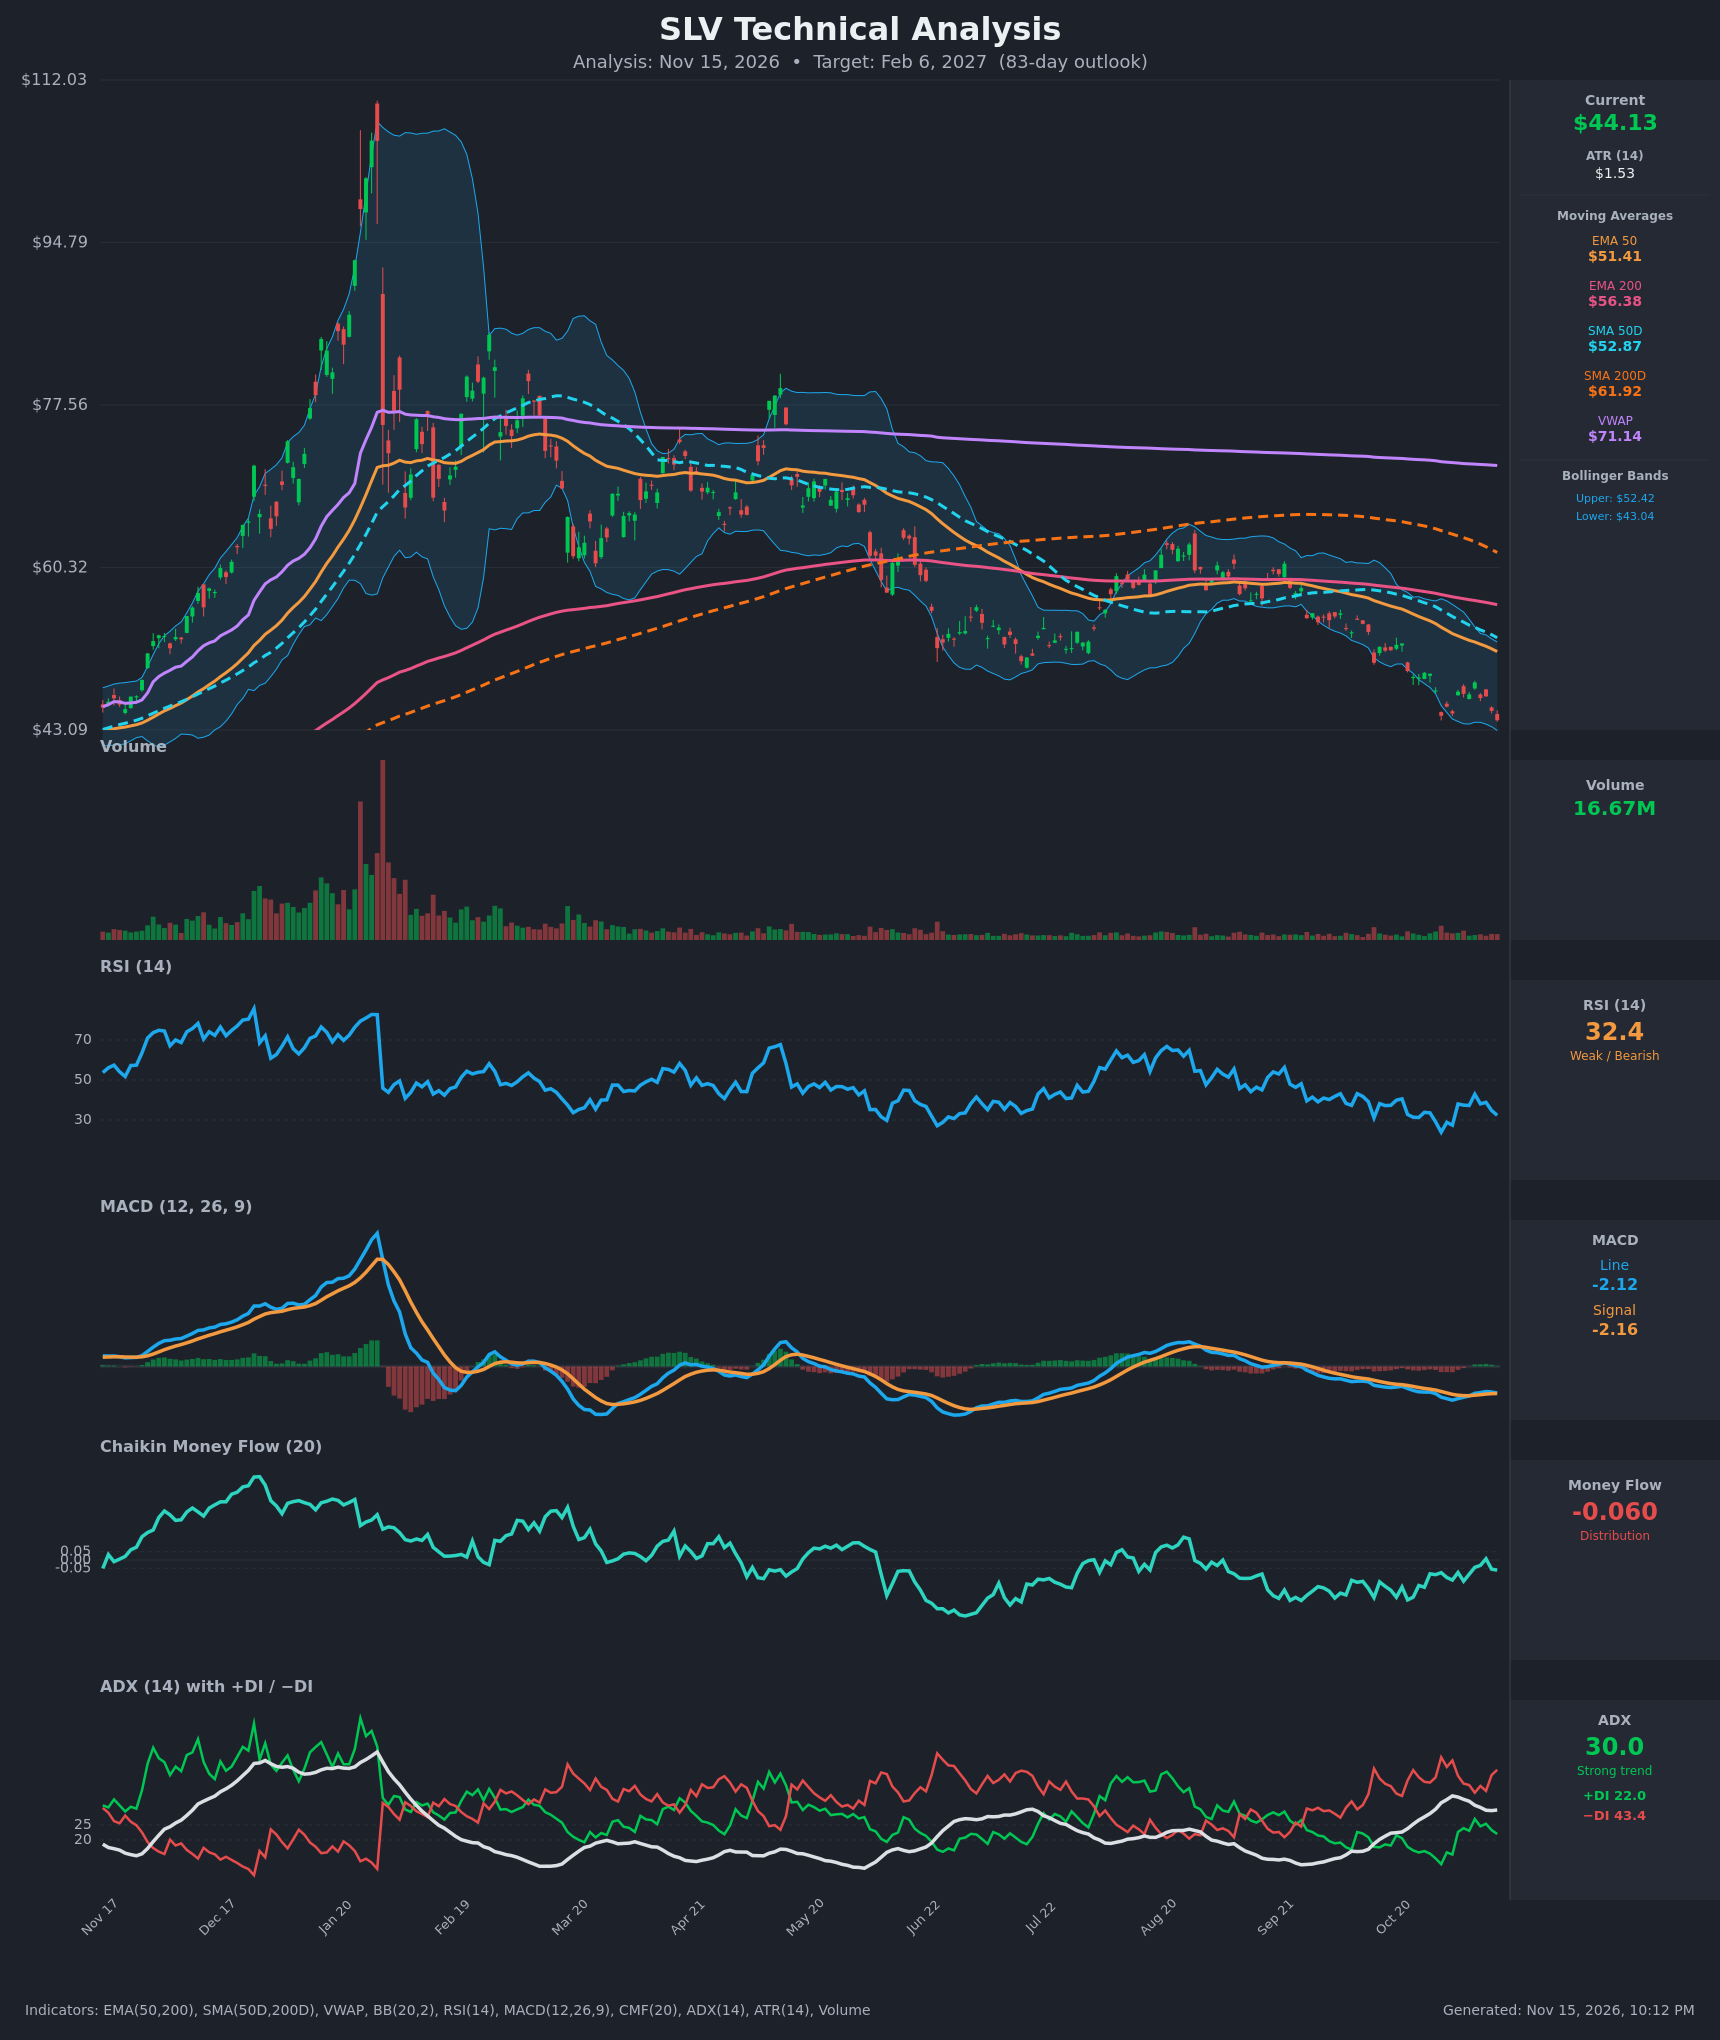
- RSI (14): 32.36, just above oversold. It bottomed at 23.9 on Oct 30 and has bounced only weakly since, with lower highs near 43 and 38. Momentum is still bearish, though close to washed out. [Bearish]
- 20 EMA: The 20 EMA isn't supplied, so I use the EMA 50 ($51.41) as the nearest trend gauge. Price at $44.13 is about 14% below it, and the EMA 50 is still falling (from $55.12 on Oct 26). The EMA 50 sits below the EMA 200 ($56.38), so overhead averages act as resistance. [Bearish]
- MACD: Line -2.121 vs signal -2.161, a marginally positive histogram of about +0.04. The line has been drifting sideways to lower, with a bearish crossover in late October and a brief re-cross on Nov 9. The line is rolling over again after peaking at -2.004, and it is deep below zero. This is a flat, weak signal. [Bearish]
- Bollinger Bands (20): Price is $44.13 against a lower band of $43.04 and an upper band of $52.42. It is hugging the lower band in a "band walk," which signals trend persistence rather than a reversal. The wide bands reflect high volatility. [Bearish]
- CMF (20): -0.060, just under the -0.05 threshold. It has been negative for most of the year and only briefly touched +0.007 on Nov 11. Selling pressure is mild but persistent. [Distribution]
- ADX (14): 30.0 with -DI at 43.4 and +DI at 22.0. This is a strong trend with bears firmly in control (-DI is about twice +DI). ADX is above 25 but has levelled off from its 34.7 peak, so the trend is slightly maturing but intact. [Strong Trend – Bearish]
- Volume: 16.67M, well below the huge volumes of the January peak and light relative to the year. The decline is orderly, with no climactic capitulation volume yet, so a durable washout low is not confirmed. [Neutral-to-Bearish: no capitulation]
DIVERGENCES & TRENDS
- Mild bullish divergence: On Oct 30 price closed at $44.60 with RSI at 23.9. On Nov 13 price made a lower close at $44.13 with RSI at 32.4, and the MACD line is also higher (-2.12 vs -2.45). This hints at fading downside momentum, but it is not confirmed by a price higher low or volume.
- Moving-average structure: The death cross is already in place (SMA50D $52.87 below SMA200D $61.92, EMA50 below EMA200). Price is below every average (SMA200D, EMA200, SMA50D, EMA50) and far below VWAP ($71.14), which means sustained selling since the January parabolic top near $110.
- Trend: The chart shows a series of lower highs and lower lows since February. The August rally failed at the declining EMA200 and SMA50D (~$58-60), then broke down.
- DI: -DI has been above +DI for most of the past year. The attempted +DI recovery (27.0 vs 35.8 on Nov 9) has already rolled over.
- MACD vs signal: The lines are tangled near -2.1 with no decisive bullish cross.
CHART PATTERNS
- The broad structure matches a bearish continuation (descending channel / lower highs, lower lows). It also resembles a Bearish Expanding/Descending Triangle-type breakdown, with the old $50-52 base (June-Sept lows) broken and now acting as resistance.
- The 2026 parabolic spike followed by a lower-high rebound in March-May looks like a Bearish Double Top / distribution structure on the larger timeframe. Its measured move points to continued weakness.
- Price is breaking below the prior June-Oct range ($50-52). Projecting that range height (~$8-9) below the breakdown suggests $41-43 as an initial target and $36-38 as an extended one.
- No confirmed reversal pattern is visible yet. A Bullish Double Bottom would need a retest of the Oct 30 low (~$44.6) holding, which is not confirmed.
POTENTIAL SCENARIOS
- Scenario 1: Bearish Trend Continuation — Strong ADX and -DI dominance, a death cross, and price below all averages keep sellers in control. Rallies fade at the declining EMA50/prior base. Trigger: daily close below ~$43.00 (lower Bollinger Band) and Nov 12-13 lows. Target: $40.50 initially, with an extension to $36-37. Invalidation: daily close above $48.15 (the Nov 9 swing high). (50% probability)
- Scenario 2: Bullish Oversold Bounce / Base Formation — RSI/MACD divergence and a touch of the lower band lead to a mean-reversion rally and a double bottom near $43-44. Trigger: close above $46.50 with rising volume and CMF back above +0.05. Target: $48-51 (EMA50 ~$51 and the prior breakdown zone). Invalidation: close below $42.50. (32% probability)
- Scenario 3: Neutral Range Consolidation — Price chops between ~$41 and ~$47 as ADX fades from 30. Trigger: ADX falls below 25 with small-bodied candles. Target: $43-46. Invalidation: close outside $40-48. (18% probability)
PRICE TARGETS
For an 83-day horizon (target date Feb 6, 2027), the range should be about 18-30% of the current price.
- Target Price: $40.50
- Expected Range: $35.00 to $46.50 (width $11.50 ≈ 26% of the $44.13 current price, consistent with the 61-180 day guidance)
- Key Levels: Support at $40.00 (psychological round number, below the lower band), Resistance at $48.15 (Nov 9 swing high / pivot ahead of the falling EMA50 at $51.41)
OVERALL BIAS
OVERALL BIAS: BEARISH - Price is below every moving average with a death cross in place, ADX at 30 with -DI (43.4) far above +DI (22.0), CMF in distribution, and price walking the lower Bollinger Band. The mild RSI/MACD divergence argues for a possible bounce but lacks confirmation, so the downtrend remains the higher-probability path.
This is educational analysis and not financial advice.