SLV 62-day bearish forecast — Nov 15, 2026
- Bias: Bearish
- Timeframe: 62 days (made Nov 15, 2026, target date Jan 15, 2027)
- Price at analysis: $44.13
- Price target: $41.50
- Expected range: $36.00 – $48.50
- Result: Pending — graded after the close on Jan 15, 2027
Get a free AI analysis of SLV today
Analysis
TECHNICAL INDICATORS
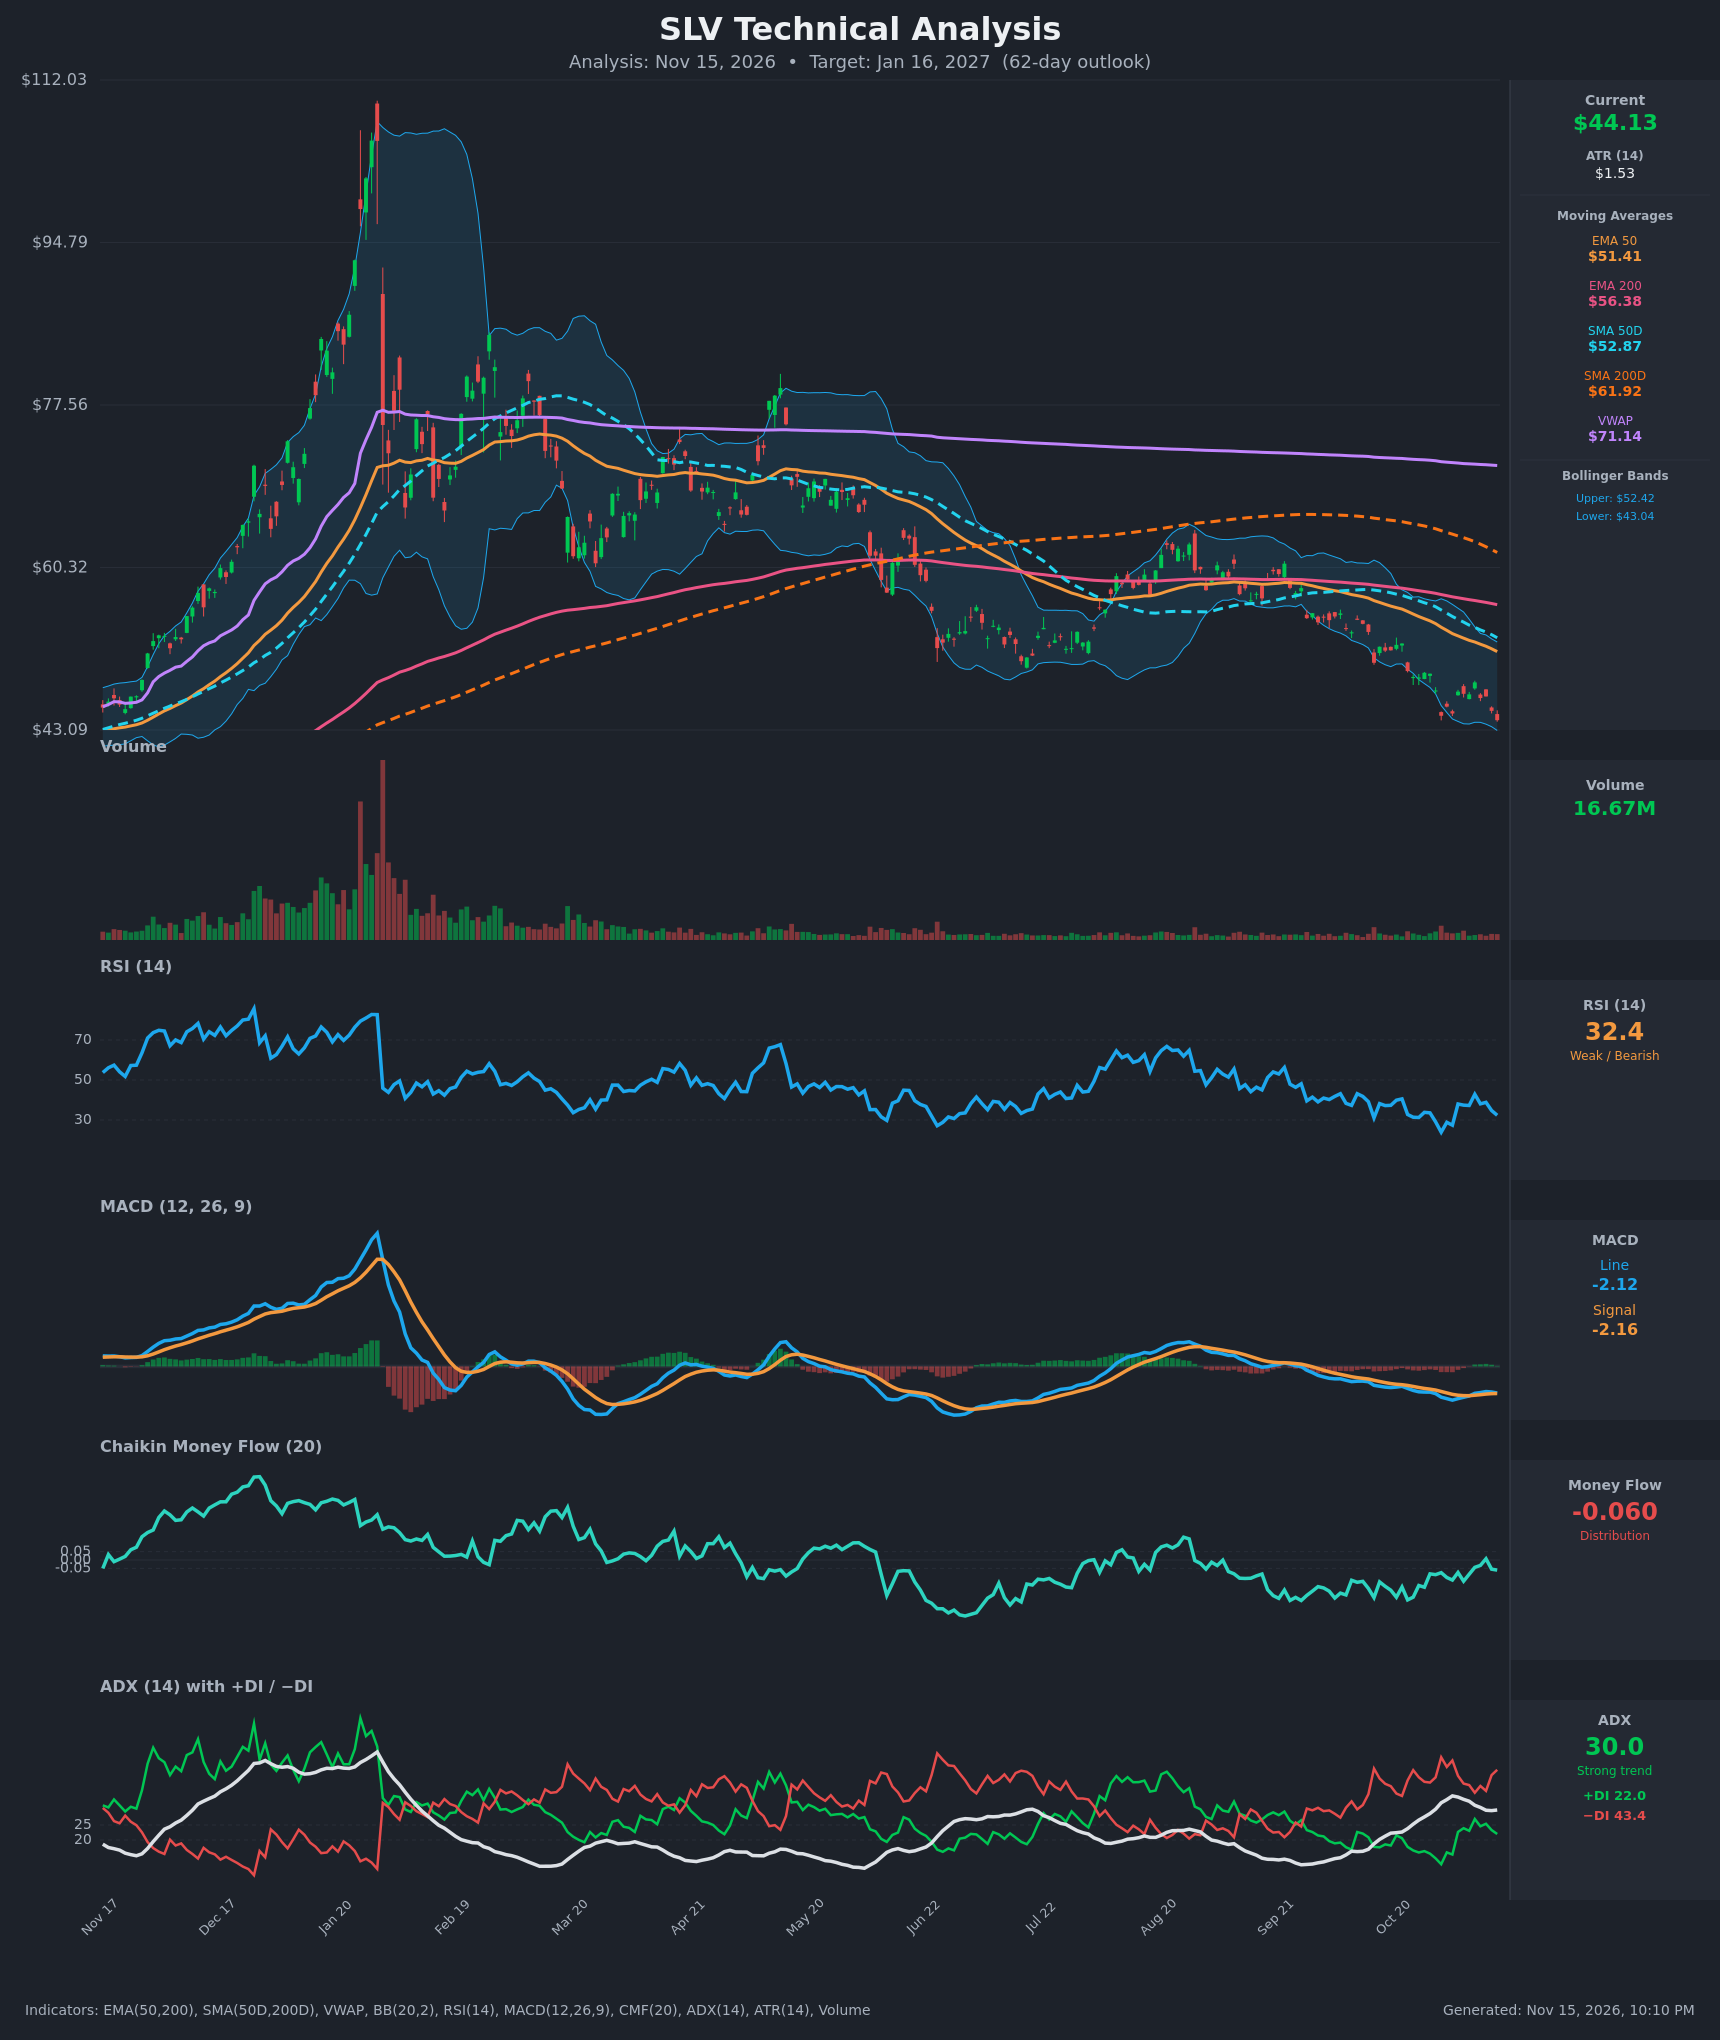
- RSI (14): 32.36, just above oversold (30) and down from 42.9 on Nov 9. The bounce failed to reach 50, and RSI has made lower highs since the October low of ~24. Momentum is weak but not yet washed out. [Bearish]
- 20 EMA: No 20 EMA was supplied. The EMA 50 is $51.41 and falling, about 14% above price, and has acted as resistance throughout the decline. Price has been below it for months. [Bearish]
- MACD: Line -2.121 vs signal -2.161, with a histogram of about +0.04. The line crossed marginally above the signal on Nov 9, but the gap has shrunk from +0.15 to +0.04, so a bearish re-cross looks imminent. Both lines are deeply negative. [Bearish]
- Bollinger Bands (20): Upper $52.42, lower $43.04, midline ~$47.73. Price at $44.13 sits in the lower quarter of the bands, about $1.09 above the lower band, after a close at $44.60 on Oct 30. Price is walking the lower band in a downtrend. Rallies have failed at or below the midline. [Bearish]
- CMF (20): -0.060, just past the -0.05 distribution threshold. It briefly turned positive (+0.007) on Nov 11 but quickly reversed. It has been negative or near zero for months, so there is no sign of accumulation. [Distribution]
- ADX (14): 30.0 with −DI (43.4) far above +DI (22.0). ADX has been above 25 since Oct 28. The −DI gap has re-widened from 12 points to 21 in the last three sessions, so the bearish trend is strong. [Strong Trend – Bearish]
- Volume: 16.67M, well below the parabolic-peak volumes. The decline is orderly, with no capitulation spike. A true selling-exhaustion low usually comes with a volume surge, so this one probably hasn't formed. [Neutral-to-Bearish: no capitulation yet]
DIVERGENCES & TRENDS
- Moving-average structure: Price ($44.13) is below the EMA 50 ($51.41), EMA 200 ($56.38), SMA 50D ($52.87), SMA 200D ($61.92) and VWAP ($71.14). The SMA 50D is below the SMA 200D (death cross), and the EMA 50 is below the EMA 200. Every moving average is sloping down, which is a textbook long-term downtrend.
- No bullish RSI divergence: RSI's Oct 30 low (23.9) came at price $44.60. Price is now lower at $44.13 while RSI is higher at 32.4. That is a mild bullish divergence, but it is weak and hasn't been confirmed by a break of the RSI downtrend or by volume.
- MACD: The tiny bullish crossover is already fading, and the histogram is flattening toward zero from above.
- Directional movement: −DI has stayed above +DI for most of the year, and the recent +DI rise to 27 was rejected. ADX is rising again, so the trend is re-strengthening.
- CMF: It has been in a persistent downtrend since the Jan peak, and the lower highs in CMF confirm distribution.
- Price structure: The pattern since the parabolic top is lower highs and lower lows, with rallies stopping at the falling SMA 50D and EMA 50.
CHART PATTERNS
- Post-blow-off top: The vertical spike to ~$110 in January was followed by a collapse. The later lower highs (~$86, ~$80, ~$66) resemble a broad Bearish Head and Shoulders / distribution structure. The neckline area around $55-58 (Jun-Oct support) has broken.
- Rising Wedge / Bearish Flag (Jun-Oct): The rally from ~$50 to ~$62 in July-August followed by a roll-over looks like a Bearish Flag / Rising Wedge. Its break lower is a bearish continuation, and measured-move targets run into the low-to-mid $40s and below.
- Current setup: Price is sitting on the lower Bollinger Band and the Oct 30 low (~$44.60 close). A clean close below ~$43 would be a fresh breakdown with no chart support below until the low $40s / $40.
- Caveat: This is a long-term downtrend with price near the lower band, so a short-term oversold bounce toward $47-48 is plausible before the next leg lower.
POTENTIAL SCENARIOS
- Scenario 1: Bearish Trend Continuation — Price stays below all major MAs, bears keep control (−DI > +DI, ADX > 25), and rallies fail near $47-48. Selling continues through the Oct lows. Trigger: daily close below $43.04 (lower BB) and the Oct 30 low area, with a MACD bearish re-cross. Target: $40.00-$41.50, with an extension to ~$38. Invalidation: daily close above $48.14 (Nov 9 high) and then the BB midline (~$47.7). (52% probability)
- Scenario 2: Bullish Oversold Mean-Reversion Bounce — RSI holds above 30, the mild bullish divergence plays out, and price rebounds toward the falling EMA 50 / SMA 50D. Trigger: close above $47.20 with CMF back above +0.05. Target: $50.00-$52.00 (EMA 50 / upper band). Invalidation: close below $43.00. (30% probability)
- Scenario 3: Neutral Base-Building Range — Price chops between ~$42.50 and ~$48 as selling slows and the ADX fades. Trigger: ADX rolling over below 25 and volume drying up. Target: ~$44-46. Invalidation: close outside the $42.50-$48.00 range. (18% probability)
PRICE TARGETS
- Target Price: $41.50 (62-day, to Jan 16, 2027)
- Expected Range: $36.00 to $48.50. The width is $12.50, or about 28% of the $44.13 price, which fits the 61-180 day guidance (18-30%) and is consistent with ATR of $1.53 scaled over ~62 trading days.
- Key Levels: Support at $43.04, Resistance at $47.20
OVERALL BIAS
OVERALL BIAS: BEARISH - Price is below every major moving average, the death cross is in place, ADX is 30 with −DI far above +DI, CMF shows distribution, and the MACD bounce is fading with no capitulation volume yet. The oversold RSI (32) raises the chance of a bounce toward $47-48, but the evidence favors lower prices, with a $41.50 target.
This is educational analysis and not financial advice.