SLV 48-day bearish forecast — Nov 15, 2026
- Bias: Bearish
- Timeframe: 48 days (made Nov 15, 2026, target date Jan 1, 2027)
- Price at analysis: $44.13
- Price target: $41.50
- Expected range: $37.00 – $46.50
- Result: Pending — graded after the close on Jan 1, 2027
Get a free AI analysis of SLV today
Analysis
TECHNICAL INDICATORS
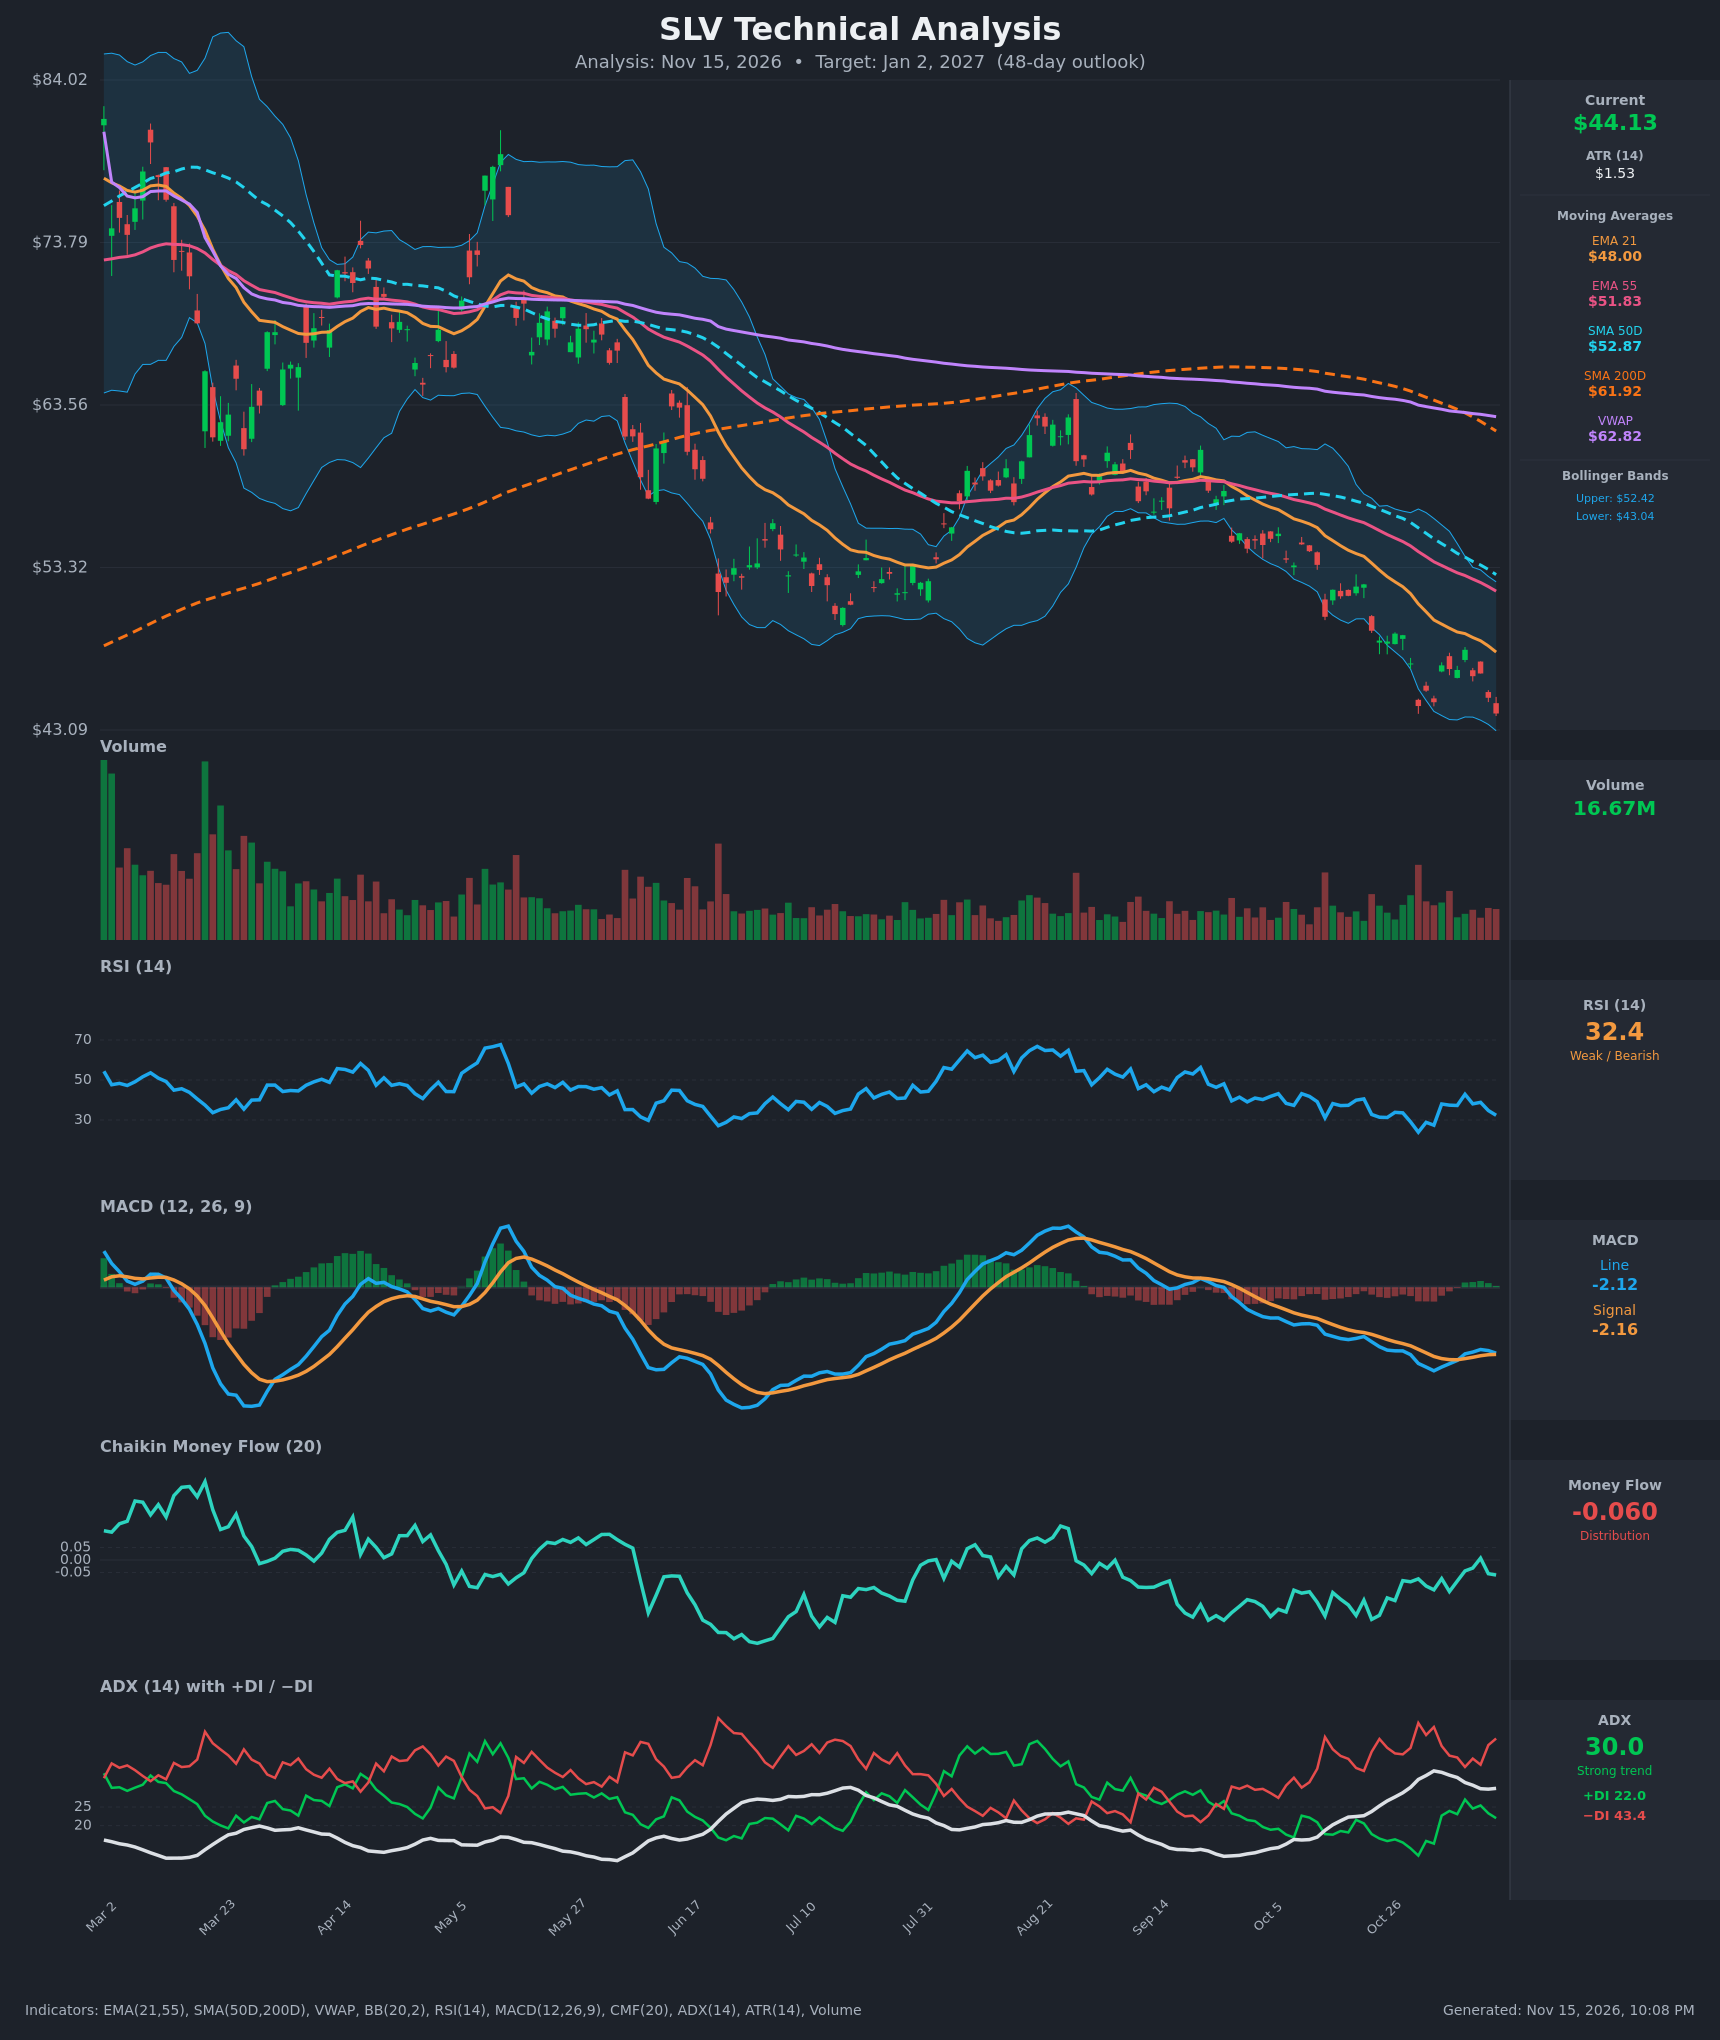
- RSI (14): 32.36, just above oversold (30) after repeated failures to hold above ~38-43. It has made lower highs since the early-Nov bounce, so momentum is still pointing down. [Bearish]
- 20 EMA: The EMA 21 is at $47.997, about 8.8% above the $44.13 price, and falling steadily. The EMA 55 ($51.83) is far above it and also declining. Price has stayed below both for weeks, and the EMA 21 is acting as dynamic resistance. [Bearish]
- MACD: Line -2.121 vs signal -2.161. The line is barely above the signal after a small bullish cross in early Nov, but the gap is shrinking again (it was -2.004 vs -2.204 on Nov 11). The histogram is near zero and turning negative, and both lines are deep below zero. This is a weak, fading bounce in momentum, not a reversal. [Bearish]
- Bollinger Bands (20): Upper $52.42, lower $43.04. Price at $44.13 is in the lower band, about 12% of the band width above the lower band, and the bands are sloping down. This is a "walking the band" downtrend, which is oversold but not a reversal signal on its own. [Bearish]
- CMF (20): -0.060, just below the -0.05 distribution threshold. It has been flat to negative since the summer, with a brief tick to +0.007 on Nov 11 that failed. Buyers are not showing up decisively. [Distribution]
- ADX (14): 30.0 with +DI 22.0 and -DI 43.4. -DI is on top by a wide margin, and ADX is above 25, so the downtrend is strong. ADX is slightly off its Nov 3 high (34.7), so the trend is a little less intense but intact. [Strong Trend - Bearish]
- Volume: 16.67M, moderate and not climbing. Recent red candles carry no capitulation-sized spike, so there are no signs of a selling climax, which would be needed for a durable low. [Neutral to Bearish: no capitulation]
DIVERGENCES & TRENDS
- Death cross / MA stack: The MAs are fully bearish: price ($44.13) < EMA21 ($48.00) < EMA55 ($51.83) < SMA50 ($52.87) < SMA200 ($61.92) < VWAP ($62.82). The SMA50 is already well below the SMA200 (the death cross happened months ago), and the SMA200 is now rolling over.
- RSI: There is no clear bullish divergence. The RSI low of 23.9 (Oct 30) came at $44.60, and price now sits at $44.13 with RSI at 32.4. That is a mild bullish divergence in RSI (a higher RSI low on a slightly lower price low). It is a modest warning for bears, but RSI has not yet confirmed with a break above 40-43.
- MACD: The MACD line has stopped making new lows (-2.69 on Nov 3 vs -2.12 now), but it is rolling over again versus the signal line.
- DI: -DI has been above +DI for most of the chart. A brief narrowing on Nov 9-11 (27.0 vs 35.8) reversed, and the gap widened again.
- Price structure: A clear series of lower highs and lower lows from the Aug peak (~$65), and a break below the Jul-Sep support area (~$50-52).
CHART PATTERNS
- Primary pattern: A sustained downtrend with a bearish flag / small bearish pennant appearing in the Nov 2-12 consolidation ($44.6-$48.1) under falling EMAs. Price has now broken the flag's lower edge (~$45) on the Nov 12-13 decline. A measured move from the pole (~$52 to ~$44.6, about $7-8) would point toward the high $30s.
- Competing pattern: A bullish falling wedge / double bottom attempt near $44.6 and $44.13 (Oct 30 and Nov 13), supported by the mild RSI divergence. It needs a close above ~$48.1 to confirm, which is also the EMA21 level.
- Evidence weighting: The trend, DI, and MA structure favor the continuation (bearish flag) read, while the double-bottom is not yet confirmed.
POTENTIAL SCENARIOS
- Scenario 1: Bearish Trend Continuation — Price breaks below the lower Bollinger Band and the $43-44 area and continues down in a strong ADX downtrend, with relief bounces capped at the EMA21. Trigger: daily close below $43.00 with CMF staying under -0.05. Target: $39.50-$41.00 (the flag measured move is lower, but the oversold state tempers it). Invalidation: close above $48.00 (EMA21). (50% probability)
- Scenario 2: Bullish Oversold Bounce / Double Bottom — RSI divergence and the lower-band test produce a relief rally back toward the declining EMAs, which then act as resistance. Trigger: close above $46.50-$48.10 with RSI above 43 and CMF turning positive. Target: $50.00-$52.00 (EMA55/SMA50 area). Invalidation: close below $43.00. (30% probability)
- Scenario 3: Neutral Basing Range — Price chops between $42 and $48 as selling exhausts and ADX fades. Trigger: ADX falls below 25 and volume dries up. Target: $43.50-$46.50. Invalidation: close outside $41.50-$48.50. (20% probability)
PRICE TARGETS
For the 48-day timeframe (the guide is ~12-18% of current price for 30-60 days; the range is slightly wider than that because ATR is high at $1.53, ~3.5% daily):
- Target Price: $41.50 (about -6% from the current $44.13, in line with the bearish bias but tempered by oversold conditions and a probable relief bounce)
- Expected Range: $37.00 to $46.50 (width $9.50, about 21.5% of the current price; slightly wider than the 12-18% guide because of high volatility and a two-sided risk profile)
- Key Levels: Support at $43.00 (lower Bollinger Band), Resistance at $48.00 (EMA21)
Self-check: width $9.50 / $44.13 = 21.5%. This is above the 30-60 day guide, and it is justified by ATR-based volatility (48 days x ~$1.53 daily ATR implies wide dispersion). Target is below current price, so it is consistent with a bearish bias.
OVERALL BIAS
OVERALL BIAS: BEARISH - The stack of moving averages is fully bearish, ADX is 30 with -DI (43.4) far above +DI (22.0), CMF is in distribution, and the MACD bounce is fading. A relief rally is likely at some point given the mild RSI divergence, but it should meet resistance at the EMA21 (~$48), so the net 48-day drift favors lower prices.
This is educational analysis and not financial advice.