SLV 27-day bearish forecast — Nov 15, 2026
- Bias: Bearish
- Timeframe: 27 days (made Nov 15, 2026, target date Dec 11, 2026)
- Price at analysis: $44.13
- Price target: $42.30
- Expected range: $37.80 – $47.40
- Result: Pending — graded after the close on Dec 11, 2026
Get a free AI analysis of SLV today
Analysis
TECHNICAL INDICATORS
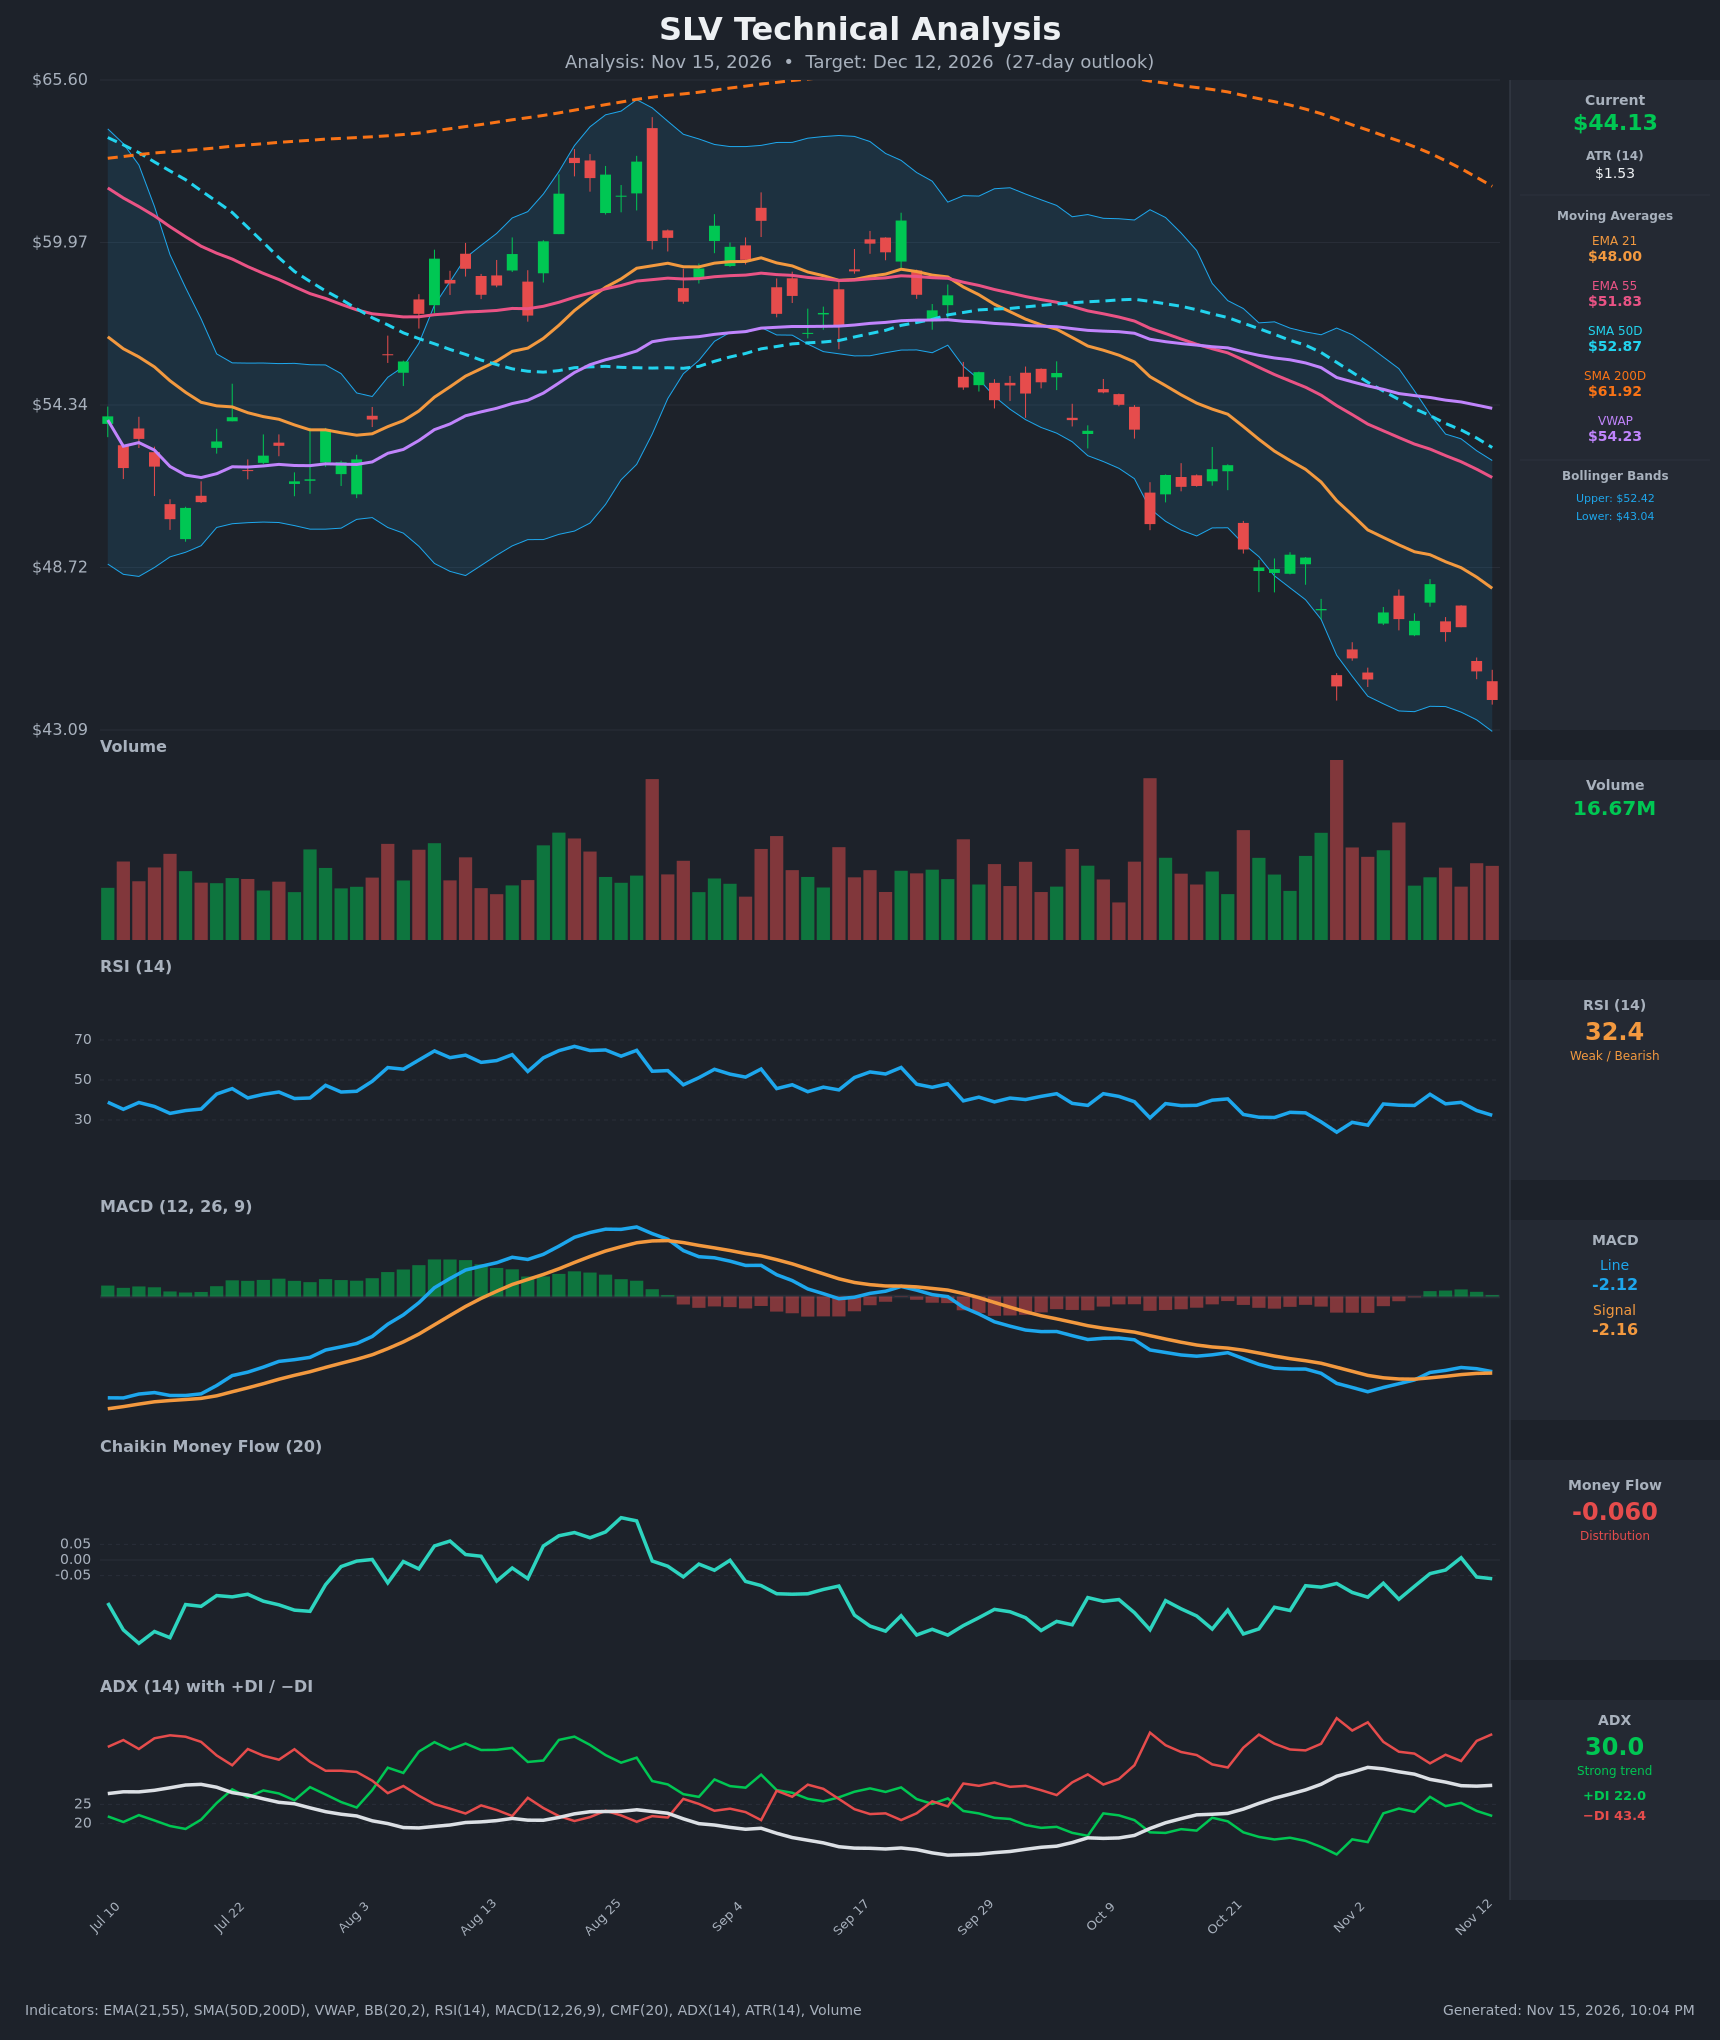
- RSI (14): 32.36, near oversold but not below 30. It has ranged 23.9–43 over the last 15 bars, with lower highs since the Nov 9 peak of 42.9. Momentum is weak and has not yet shown a bullish divergence. [Bearish]
- 20 EMA (EMA 21): $48.00, with price at $44.13 about 8% below it. The EMA21 is well below the EMA55 ($51.83) and falling every bar, so it acts as dynamic resistance. [Bearish]
- MACD: Line -2.12 vs signal -2.16. The line is only just above the signal after a marginal bullish crossover around Nov 9, and the histogram is about flat at +0.04. The line is deeply negative, and the crossover is fading as the latest bar's price drop pulls the line back toward the signal. [Neutral]
- Bollinger Bands (20): Upper $52.42, lower $43.04, mid about $47.7. Price at $44.13 sits in the lower quarter of the bands, about $1.09 above the lower band. It has been walking the lower band, which is typical of a persistent downtrend rather than a reversal signal. [Bearish]
- CMF (20): -0.060, just under the -0.05 threshold. It has been negative nearly the whole period, apart from a brief +0.007 on Nov 11, so there is mild sustained distribution. [Distribution]
- ADX (14): 30.0 with −DI 43.4 well above +DI 22.0. ADX was above 25 for the entire window and is now rising again after dipping. This is a strong downtrend with bears in control. [Strong Trend – Bearish]
- Volume: 16.67M, around average with no capitulation spike. Heavy red-volume bars on the drops (late Oct) outweigh the green bars. The latest decline lacks a washout volume signature. [Bearish – mild selling pressure]
DIVERGENCES & TRENDS
- Moving average stack: Price ($44.13) < EMA21 ($48.00) < EMA55 ($51.83) < SMA50D ($52.87) < SMA200D ($61.92) < VWAP ($54.23). This is a fully bearish alignment. The SMA50D is converging toward the EMA55, and a death cross against the SMA200D has already occurred.
- No clear bullish divergence: Price made a new low at $44.13, but the RSI low of 32.4 sits above the Oct 30 trough of 23.9. That is a weak hint of momentum improvement, but price is also above the Oct 30 close of $44.60 only marginally, so it is not a confirmed divergence.
- MACD: The line has flattened and tried to turn up, but the signal is still declining. The Nov 9 bullish cross is effectively failing, as the line has already returned below its Nov 9 level and the histogram is near zero.
- DI: −DI has been above +DI since early Oct, with only brief narrowing around Nov 9–11. The latest bars show the gap widening again.
- Price vs VWAP: Price is roughly 19% below VWAP and the SMA200D, which signals an extended downtrend with a stretched mean-reversion setup.
CHART PATTERNS
- Descending channel / Bearish Flag-like structure: After the sharp drop from the Aug highs, price is making lower highs and lower lows in a stair-step decline. The late-Oct to mid-Nov action looks like a pause (a bearish pennant/flag) just above the lower Bollinger Band.
- Failed base: The Oct 30 to Nov 3 lows ($44.60–44.84) were retested at $44.13 with a lower low, and a move below that area would be a breakdown of a short double-bottom attempt.
- Targets: The measured move from the flag (the flagpole from about $54 to $44.6 is about $9–10) would project toward $38–40 on a breakdown, though over 27 days a partial move is more realistic. The bearish case relies on the $43.04 band and the $43.50 area breaking.
- Counter-risk: A Bullish Double Bottom needs a hold at $44.1–44.6 and a break above about $47.2. That would be a reversal setup, but it is not confirmed.
POTENTIAL SCENARIOS
- Scenario 1: Bearish Trend Continuation — The strong downtrend (ADX 30, −DI 43) continues with price breaking the $44.60/$43.04 support cluster. Distribution persists and rallies fail at the falling EMA21. Trigger: daily close below $43.00 with volume above 17M. Target: $40.50, with an extension to $38.50. Invalidation: daily close above $48.00 (EMA21). (55% probability)
- Scenario 2: Bullish Oversold Bounce — RSI near 30 and price at the lower Bollinger Band trigger a mean-reversion bounce back toward the band midline and EMA21. Trigger: close above $46.50 with MACD histogram turning positive. Target: $47.80–$48.50. Invalidation: close below $43.00. (30% probability)
- Scenario 3: Neutral Range Consolidation — Price chops between $42.50 and $47.00 as selling exhausts but no catalyst appears. Trigger: ADX falling below 25 and RSI holding 30–45. Target: $44–46. Invalidation: a decisive close outside $42.50–$47.50. (15% probability)
PRICE TARGETS
- Target Price: $42.30 (27-day)
- Expected Range: $37.80 to $47.40 (width $9.60, about 21.8% of current price, in line with the 61–180 day style guidance, scaled down for the 27-day horizon; ATR of $1.53 across about 27 trading days supports a wide band)
- Key Levels: Support at $43.04 (lower Bollinger Band), Resistance at $48.00 (EMA21)
OVERALL BIAS
OVERALL BIAS: BEARISH - Price sits beneath a fully bearish moving-average stack with ADX at 30 and −DI far above +DI, CMF in mild distribution, and a failing MACD crossover. The oversold RSI raises bounce risk, but trend evidence favors continuation lower.
This is educational analysis and not financial advice.