MSTR 4-day bearish forecast — Nov 1, 2026
- Bias: Bearish
- Timeframe: 4 days (made Nov 1, 2026, target date Nov 4, 2026)
- Price at analysis: $130.53
- Price target: $129.00
- Expected range: $126.30 – $134.20
- Result: Incorrect (+11.3%) — closed at $145.28 on Nov 4, 2026; quality score 0/100
Get a free AI analysis of MSTR today
Analysis
TECHNICAL INDICATORS
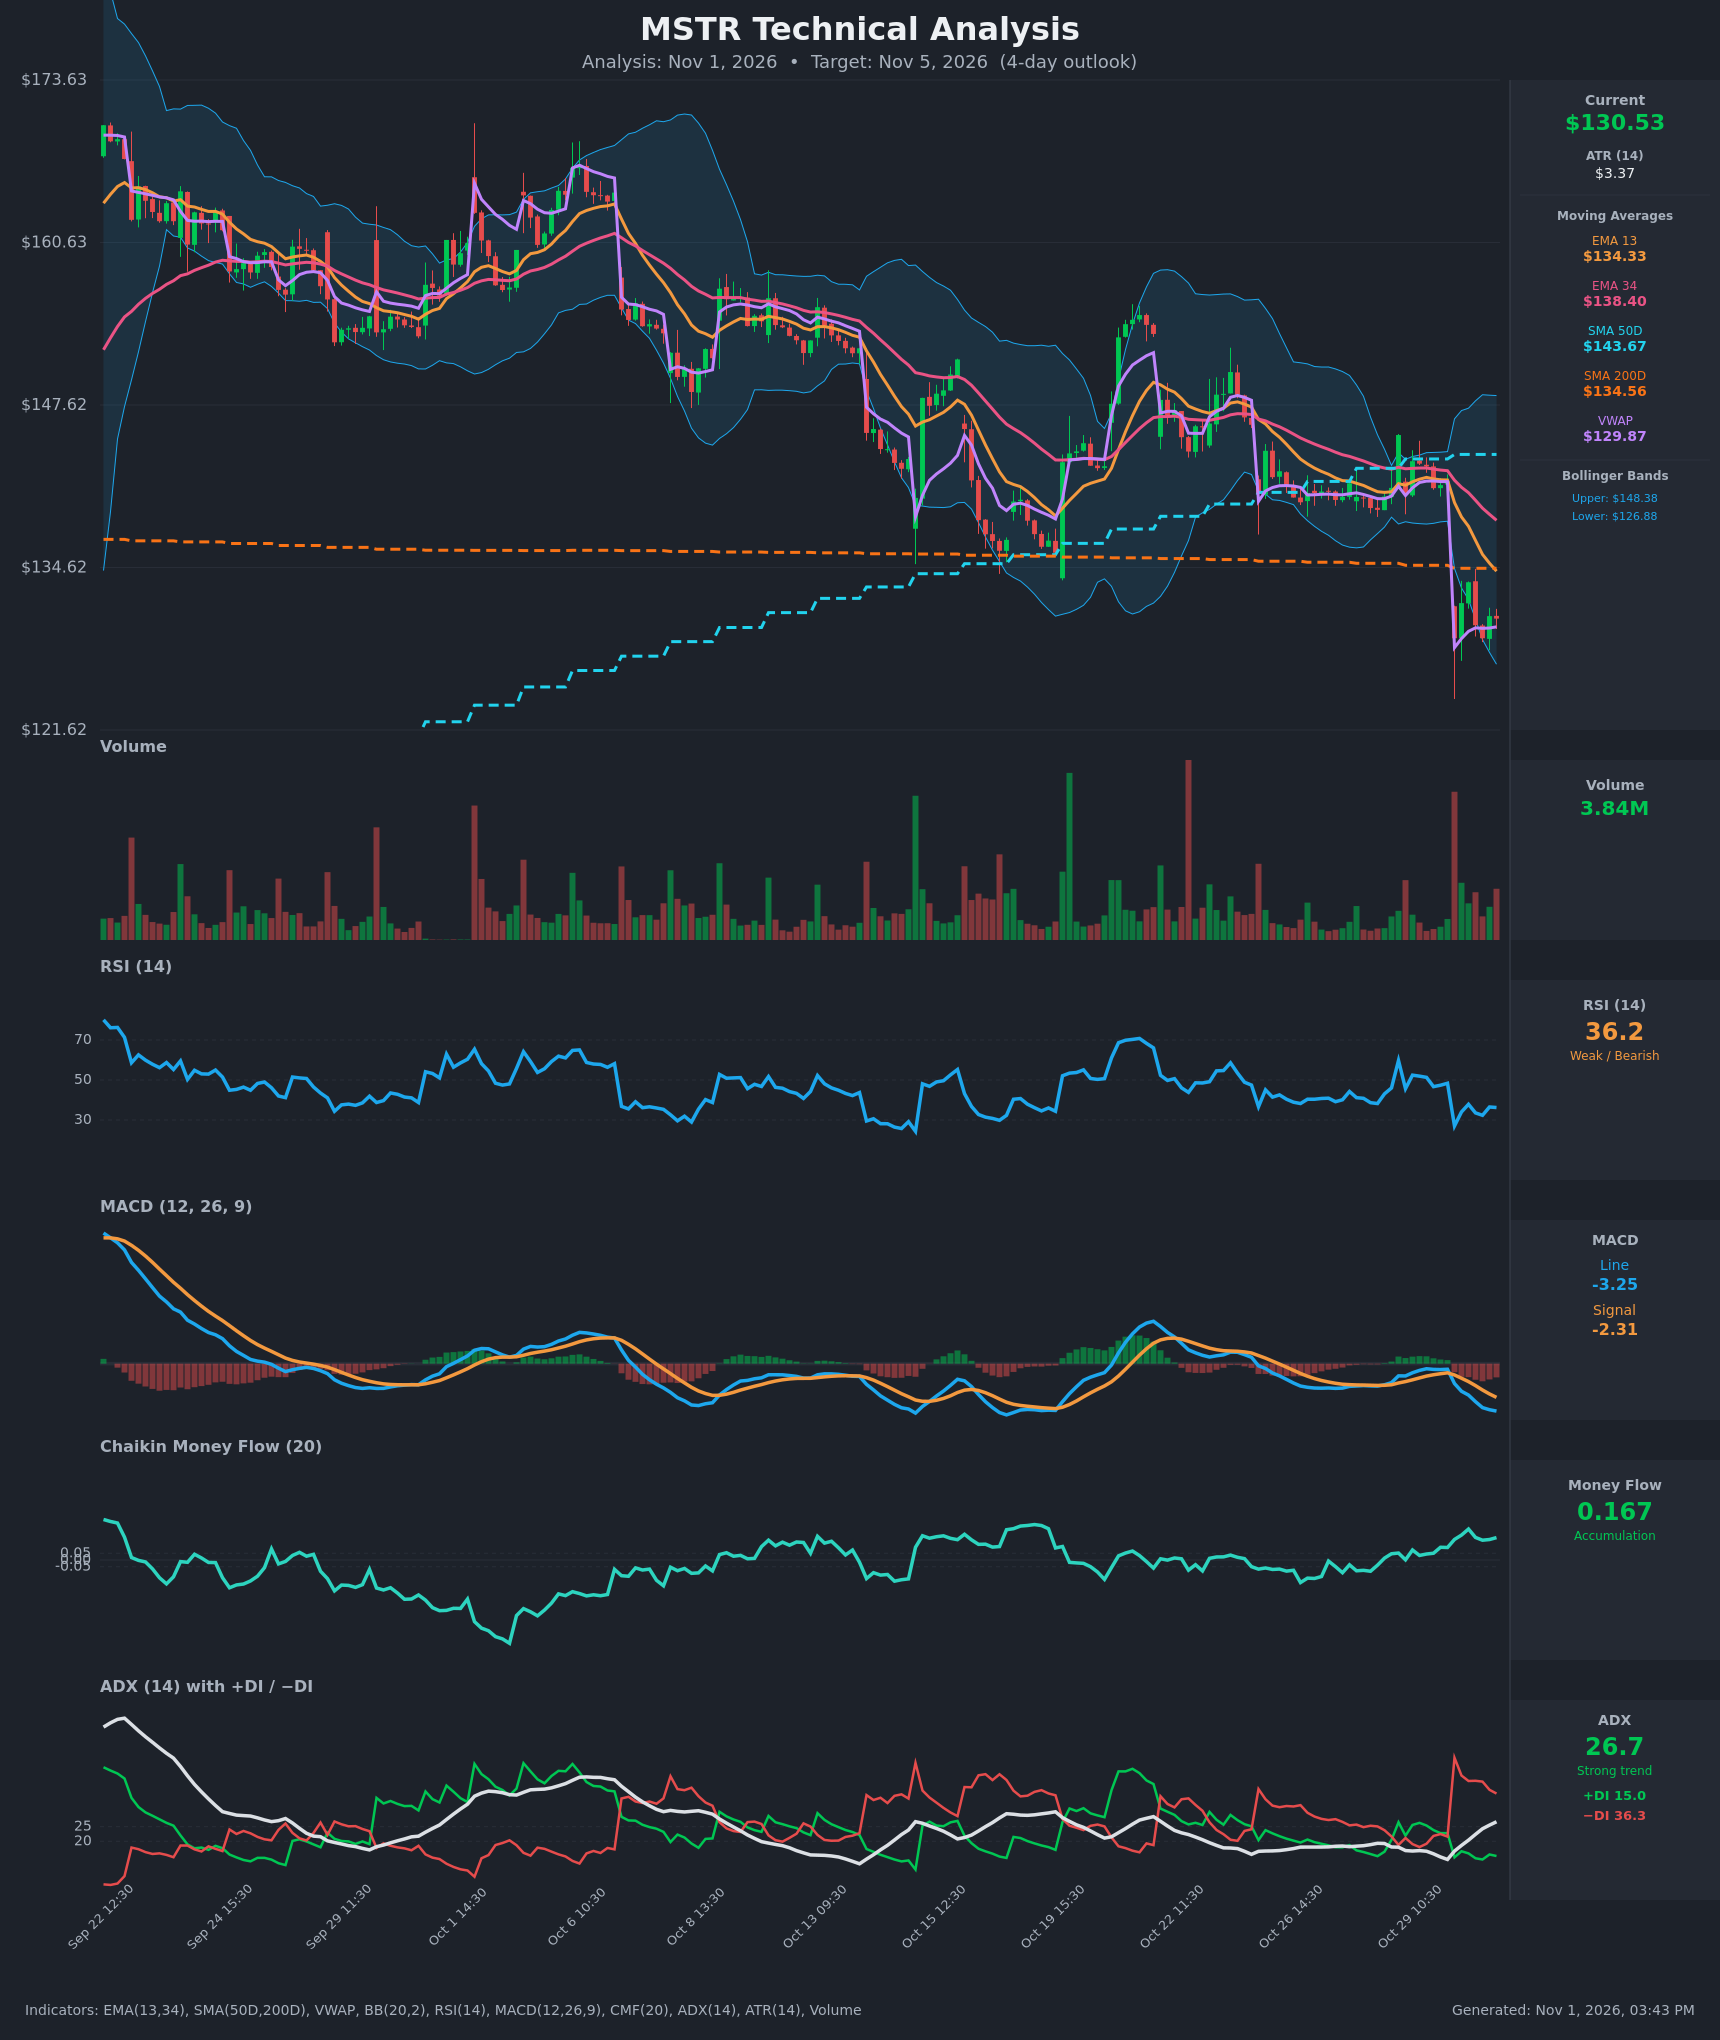
- RSI (14): 36.24, recovering slightly from the 27.0 oversold print on the Oct 30 gap-down. It is below 50 and has not regained 40, so momentum is still weak but no longer in oversold territory. [Bearish]
- 20 EMA: The chart shows EMA 13 at $134.33 and EMA 34 at $138.40. Price at $130.53 is below both, and both are sloping down steeply, so they act as overhead resistance. [Bearish]
- MACD: Line -3.25 is below signal -2.31, and the gap has widened since the bearish cross on Oct 30. The histogram is negative and still expanding. [Bearish]
- Bollinger Bands (20): Upper $148.38, lower $126.88, with price at $130.53 in the lower quarter of the band. The bands are wide after the gap-down. A wick pierced the lower band, but price has not walked it. A bounce toward the midline (~$137.6) is plausible, though a break below $126.88 would signal continuation. [Neutral]
- CMF (20): 0.167, positive and rising since Oct 29. This points to buying on the dip, though it conflicts with the price trend and may be inflated by the heavy-volume gap bar. [Accumulation]
- ADX (14): 26.7 and rising, with −DI at 36.3 far above +DI at 15.0. This is a strong, established downtrend with bears firmly in control. [Strong Trend – Bearish]
- Volume: 3.84M on the latest bar, after a large spike on the Oct 30 gap-down. Selling volume has faded in the following sessions, which hints at some exhaustion but no confirmed reversal. [Neutral / Fading Selling Pressure]
DIVERGENCES & TRENDS
- MACD: It crossed bearish on Oct 30, and the line is accelerating below zero. There is no bullish divergence in MACD.
- RSI: It has been bouncing in the 27–38 range. Price made a marginal new low at $128.96 on the 13:30 bar, while RSI at 32.3 was above the 27.0 low. This is a minor higher low that suggests selling is easing.
- CMF: Positive CMF against falling price is a mild bullish divergence, suggesting dip buying. It is not enough to override the trend indicators.
- Moving averages: EMA 13 is below EMA 34 and the gap is widening. Price has also broken below SMA200D ($134.56), which was support for weeks and now becomes resistance. SMA50D ($143.67) is above SMA200D, so there is no death cross yet, but the two are converging.
- VWAP: Price at $130.53 is slightly above the anchored VWAP of $129.87. This is a minor sign of stabilization, and VWAP is a nearby pivot.
- Gap: The Oct 30 open was a 9% gap-down from $141.53 to $128.96, leaving an unfilled gap up to ~$141.
CHART PATTERNS
- Bearish Rising Wedge / Flag-type breakdown: The Oct 22–29 range under ~$145 was a sideways consolidation. It resolved to the downside with a sharp gap through support (the SMA200D / ~$134.5 area). This resembles a bearish continuation of the larger downtrend from $170+.
- Post-breakdown base: The last several bars show small candles in a tight $129–$133.5 band. This could form a small bearish flag or a short-term base. The measured move from the flag is roughly $126–$127, which coincides with the lower Bollinger Band.
- No confirmed reversal patterns: There is no double bottom or inverted head and shoulders yet. A recovery above $134.5 would be needed to turn the picture constructive.
POTENTIAL SCENARIOS
- Scenario 1: Bearish Trend Continuation — The strong downtrend (ADX 26.7, −DI 36.3) persists. Price fails at the SMA200D / EMA 13 zone and rolls over toward the lower band. Trigger: rejection near $133–$134.5, or a break below $128.96. Target: $126.50–$127. Invalidation: a close above $135. (50% probability)
- Scenario 2: Neutral Oversold Consolidation — Price chops in the $128.5–$134 range as the RSI reset and positive CMF absorb selling, with VWAP and the lower band acting as a floor. Trigger: holding above $128.96 with low-volume candles. Target: $130–$133. Invalidation: a break outside $127 to $135. (25% probability)
- Scenario 3: Bullish Relief Bounce — A dead-cat bounce driven by CMF accumulation and oversold conditions, filling part of the gap. Trigger: a reclaim of $134.5 (SMA200D) and EMA 13 on rising volume. Target: $137–$138 (Bollinger midline / EMA 34). Invalidation: a drop back below $130. (25% probability)
PRICE TARGETS
For the 4-day timeframe, the range width should be about 4–8% of the current price. Range of $126.30 to $134.20 is $7.90 wide, or about 6.1%, which fits.
- Target Price: $129.00 (4 days ahead)
- Expected Range: $126.30 to $134.20
- Key Levels: Support at $128.96 (recent low; next at $126.88, the lower Bollinger Band). Resistance at $134.33 (EMA 13, with SMA200D at $134.56 just above).
OVERALL BIAS
OVERALL BIAS: BEARISH - The strong downtrend (ADX 26.7, −DI 36.3 versus +DI 15.0), the bearish MACD cross with an expanding negative histogram, and price below both EMAs and SMA200D outweigh the positive CMF and oversold bounce potential. Overhead resistance at $134.3–$134.6 is likely to cap rallies.
This is educational analysis and not financial advice.