MSTR 27-day neutral forecast — Nov 15, 2026
- Bias: Neutral
- Timeframe: 27 days (made Nov 15, 2026, target date Dec 11, 2026)
- Price at analysis: $111.62
- Price target: $105.00
- Expected range: $96.50 – $113.00
- Result: Pending — graded after the close on Dec 11, 2026
Get a free AI analysis of MSTR today
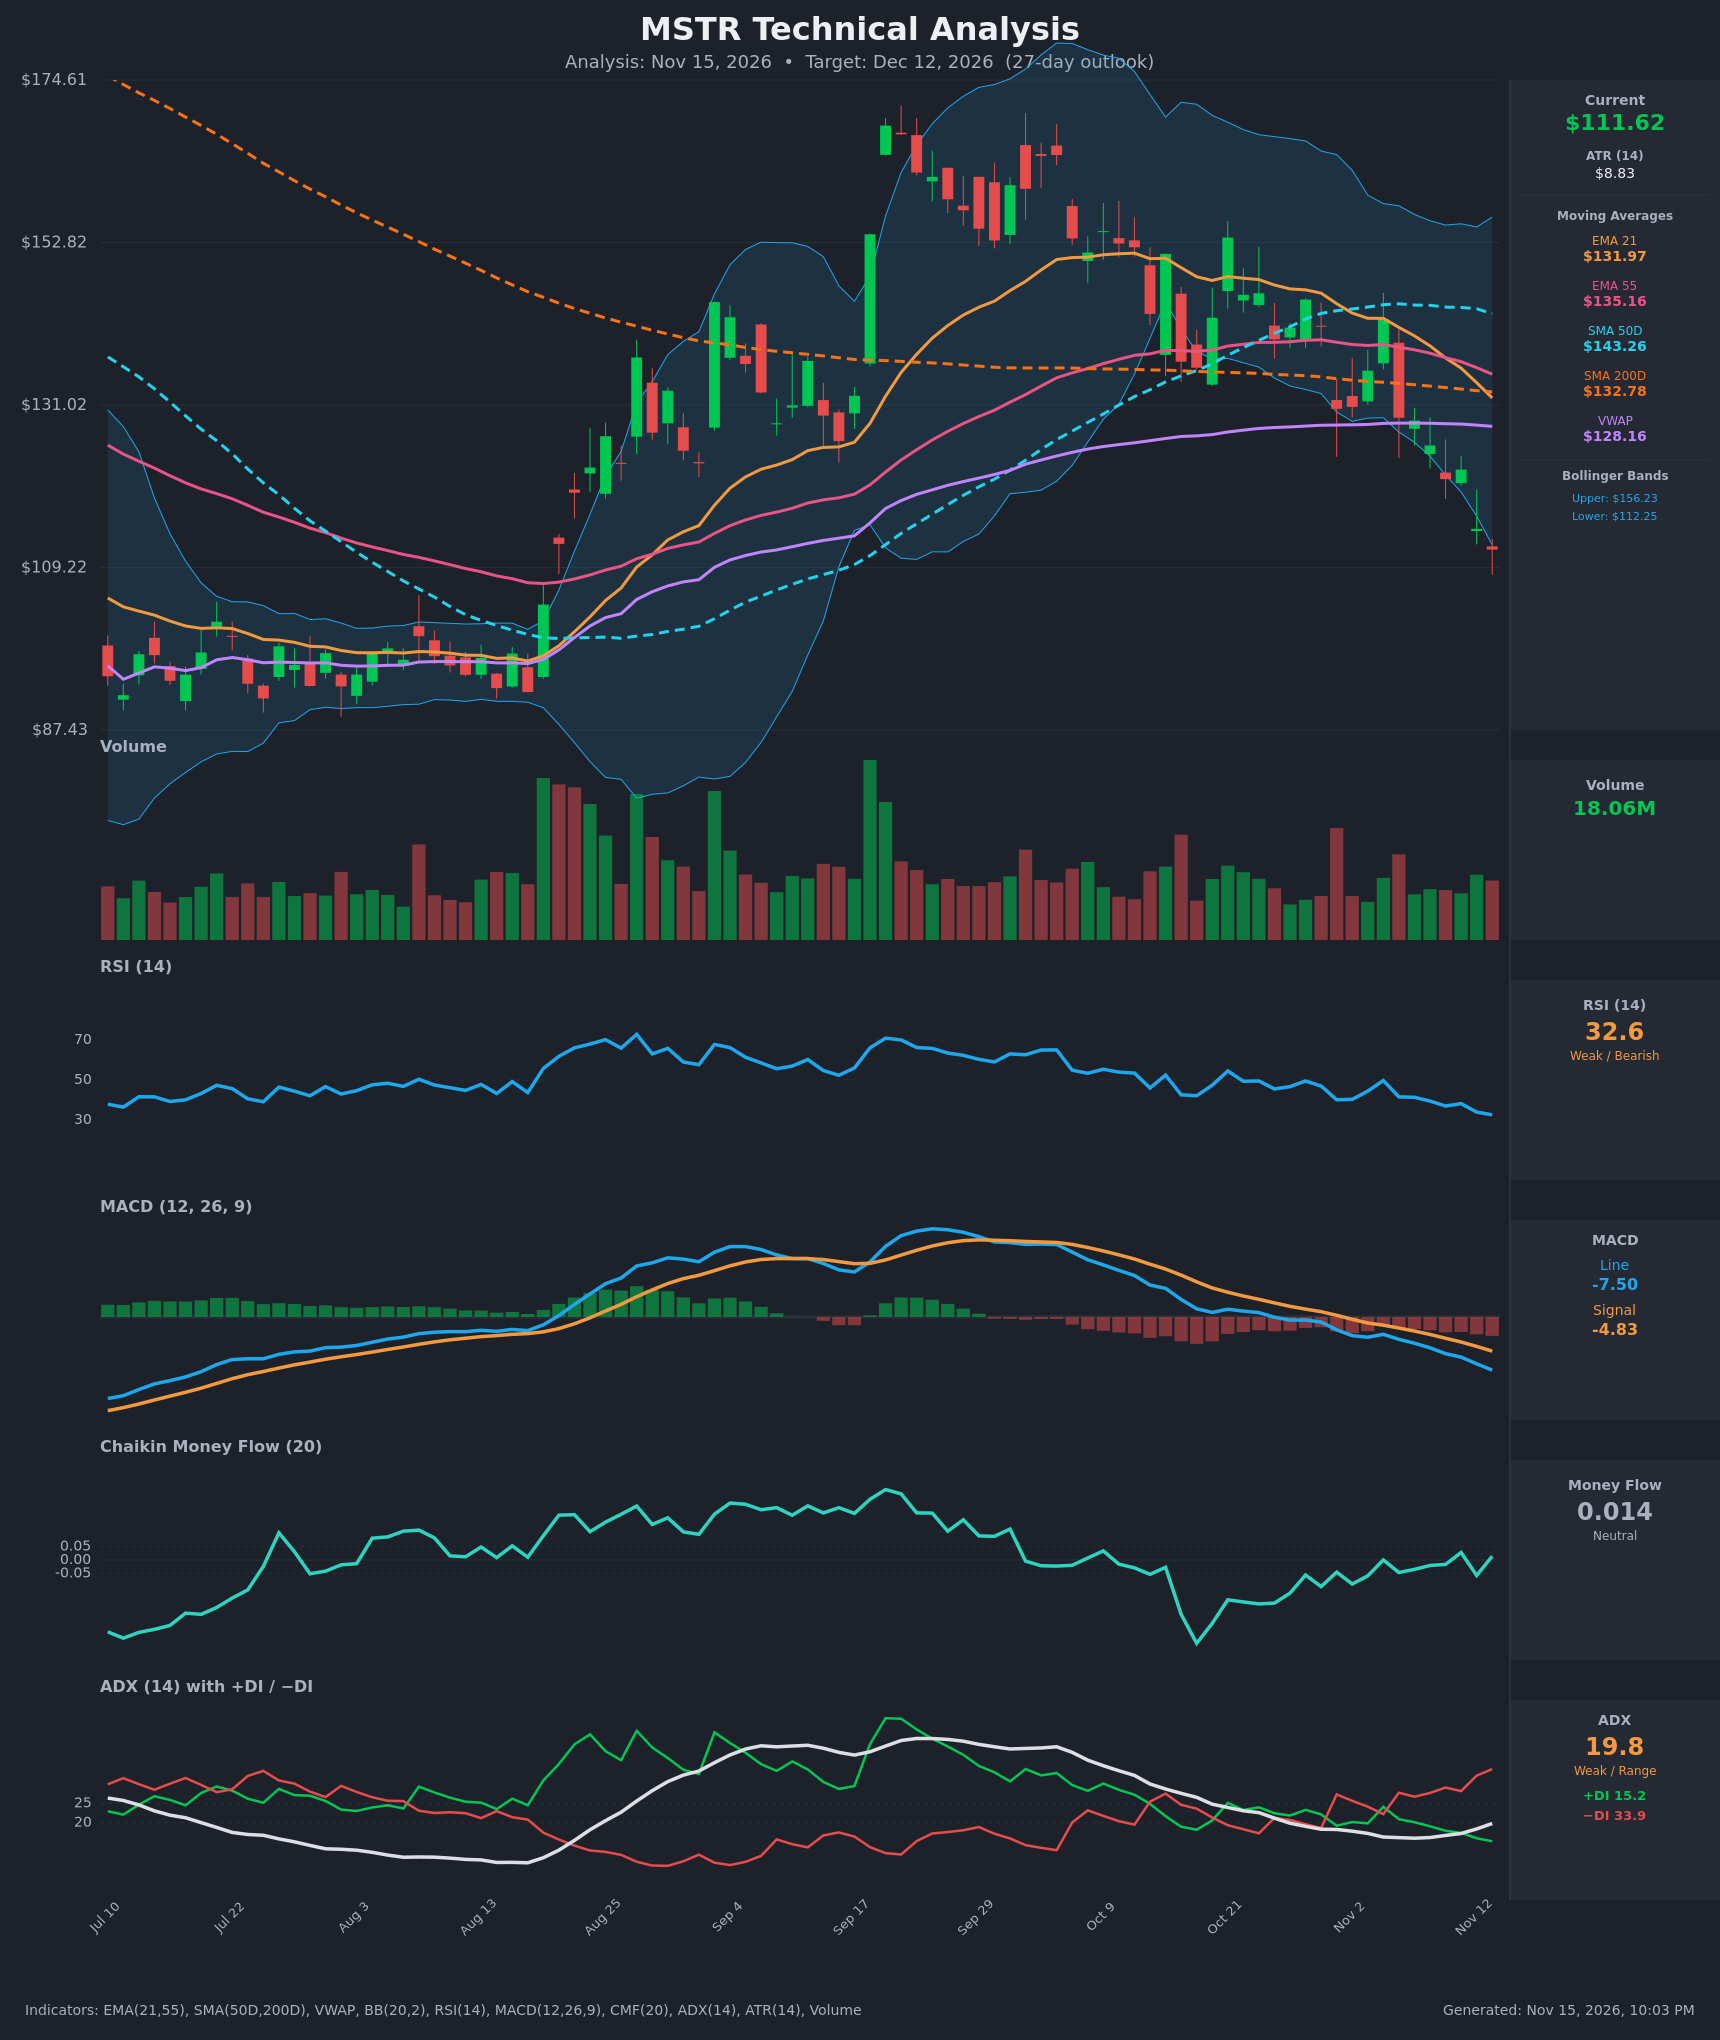
Analysis
TECHNICAL INDICATORS
- RSI (14): 32.57 and falling, down from about 49.7 on Nov 4 and close to the oversold line at 30. It has made lower lows along with price, so there is no bullish divergence yet. Momentum is clearly weak, though a bounce becomes more likely below 30. [Bearish]
- 20 EMA: The 21 EMA is at $131.97 and sloping down sharply. Price at $111.62 is about 15% below it, so it acts as overhead resistance. The 21 EMA has also crossed below the 55 EMA ($135.16), which is a bearish crossover. [Bearish]
- MACD: The line is -7.50 against a signal of -4.83. The bearish crossover happened around Oct 30 and the negative histogram keeps widening (about -2.7). Downside momentum is still accelerating. [Bearish]
- Bollinger Bands (20): Price at $111.62 is just below the lower band ($112.25), which is a stretched, oversold reading. The bands are wide (upper $156.23). Riding the lower band in a downtrend usually signals continuation, but it also raises the odds of a mean-reversion bounce toward the mid-band (about $134). [Bearish]
- CMF (20): 0.014, between -0.05 and +0.05, and it has hovered near zero for weeks. Selling is not showing up as heavy distribution, but there is no accumulation either. Money flow is not confirming a capitulation low. [Neutral]
- ADX (14): 19.8 and just starting to rise from about 16. −DI at 33.9 is far above +DI at 15.2, and the gap is widening. The trend is still weak by the ADX threshold, but direction is firmly with the bears. If ADX crosses 25, the downtrend would be confirmed as strong. [Weak but Strengthening Trend – Bearish]
- Volume: 18.06M, average to slightly below average, with no climactic spike. The recent red bars are moderate. Without a high-volume washout, there is no sign of a capitulation bottom yet. [Neutral to Mildly Bearish]
DIVERGENCES & TRENDS
- Divergences: None bullish. RSI, MACD and price are all making lower lows together, so momentum confirms the decline.
- Price vs moving averages: Price is below the EMA21 ($131.97), EMA55 ($135.16), VWAP ($128.16), SMA200D ($132.78) and SMA50D ($143.26). That is a decisive loss of every major average. Price broke below the SMA200D in the Nov 10–13 decline.
- Crossovers:
- The EMA21 crossed below the EMA55 around Nov 10 (bearish).
- The MACD crossed below its signal around Oct 30 (bearish).
- −DI crossed above +DI around Oct 30 and has stayed there.
- The SMA50D ($143.26) is still above the SMA200D ($132.78) but is falling, so a death cross is possible in the coming weeks if the weakness persists.
- Trend: A steady series of lower highs and lower lows since the ~$170 peak in mid-September. Price has now retraced almost the entire Aug–Sep rally and sits back at the top of the old August base.
- Mean-reversion risk: RSI near 30 and price outside the lower Bollinger Band make a relief bounce plausible. Such a bounce would likely meet resistance at $122–$128.
CHART PATTERNS
- Bearish Double Top / Rounded Top (reversal): The mid-September high (~$170) followed by a lower high (~$155–160) in early October fits a topping structure. The "neckline" is the August breakout zone near $109–$110, and price is testing it now. A decisive close below it would confirm the pattern.
- Targets: The full measured move (~$60 from peak to neckline) would reach the low $50s, which is unrealistic in 27 days. The practical targets are $100 first, then the $87–$90 base from July–August.
- Bearish Pennant / Flag remnants: The tight, lower-high consolidation in late October to early November resolved to the downside, which is a continuation of the decline.
- Invalidation: A reclaim of $122–$128 (the Nov 11 close and VWAP) would negate the breakdown setup.
POTENTIAL SCENARIOS
- Scenario 1: Bearish Trend Continuation / Neckline Breakdown — Price loses the $109–$110 neckline zone as −DI dominance persists and ADX climbs toward 25. The MACD histogram keeps expanding, with a possible SMA death cross later. Trigger: Daily close below $109 on rising volume. Target: $100, then $90–$95. Invalidation: Daily close above $122.35. (50% probability)
- Scenario 2: Bullish Oversold Relief Bounce — RSI turns up from about 30 and price bounces off the lower Bollinger Band and the old base. It retraces toward VWAP and the EMAs but stays in a larger downtrend. Trigger: Close above $118 with RSI back above 40. Target: $122–$128 (VWAP at $128.16). Invalidation: Close below $104. (33% probability)
- Scenario 3: Neutral Basing Range — Price stabilizes around the August breakout zone and chops between about $100 and $120 as CMF stays flat. Trigger: Several sessions of narrowing range with ADX flat below 20. Target: $108–$114. Invalidation: Close outside $100–$122. (17% probability)
PRICE TARGETS
- Target Price: $105.00 (27-day horizon)
- Expected Range: $96.50 to $113.00 (width $16.50, about 14.8% of the current price, consistent with a ~27-day horizon)
- Key Levels: Support at $100.00, Resistance at $122.35
OVERALL BIAS
OVERALL BIAS: BULLISH is not supported here, so the call is:
OVERALL BIAS: BEARISH - Price is below every major moving average, −DI (33.9) dominates +DI (15.2), the MACD is negative with a widening histogram, and RSI is making lower lows. Price is also testing the neckline of a possible topping pattern. The oversold reading (RSI ~32, price at the lower Bollinger Band) and neutral CMF leave room for a relief bounce, so conviction is moderate.
This is educational analysis and not financial advice.