MSTR 20-day bearish forecast — Nov 15, 2026
- Bias: Bearish
- Timeframe: 20 days (made Nov 15, 2026, target date Dec 4, 2026)
- Price at analysis: $111.62
- Price target: $106.00
- Expected range: $99.50 – $112.00
- Result: Pending — graded after the close on Dec 4, 2026
Get a free AI analysis of MSTR today
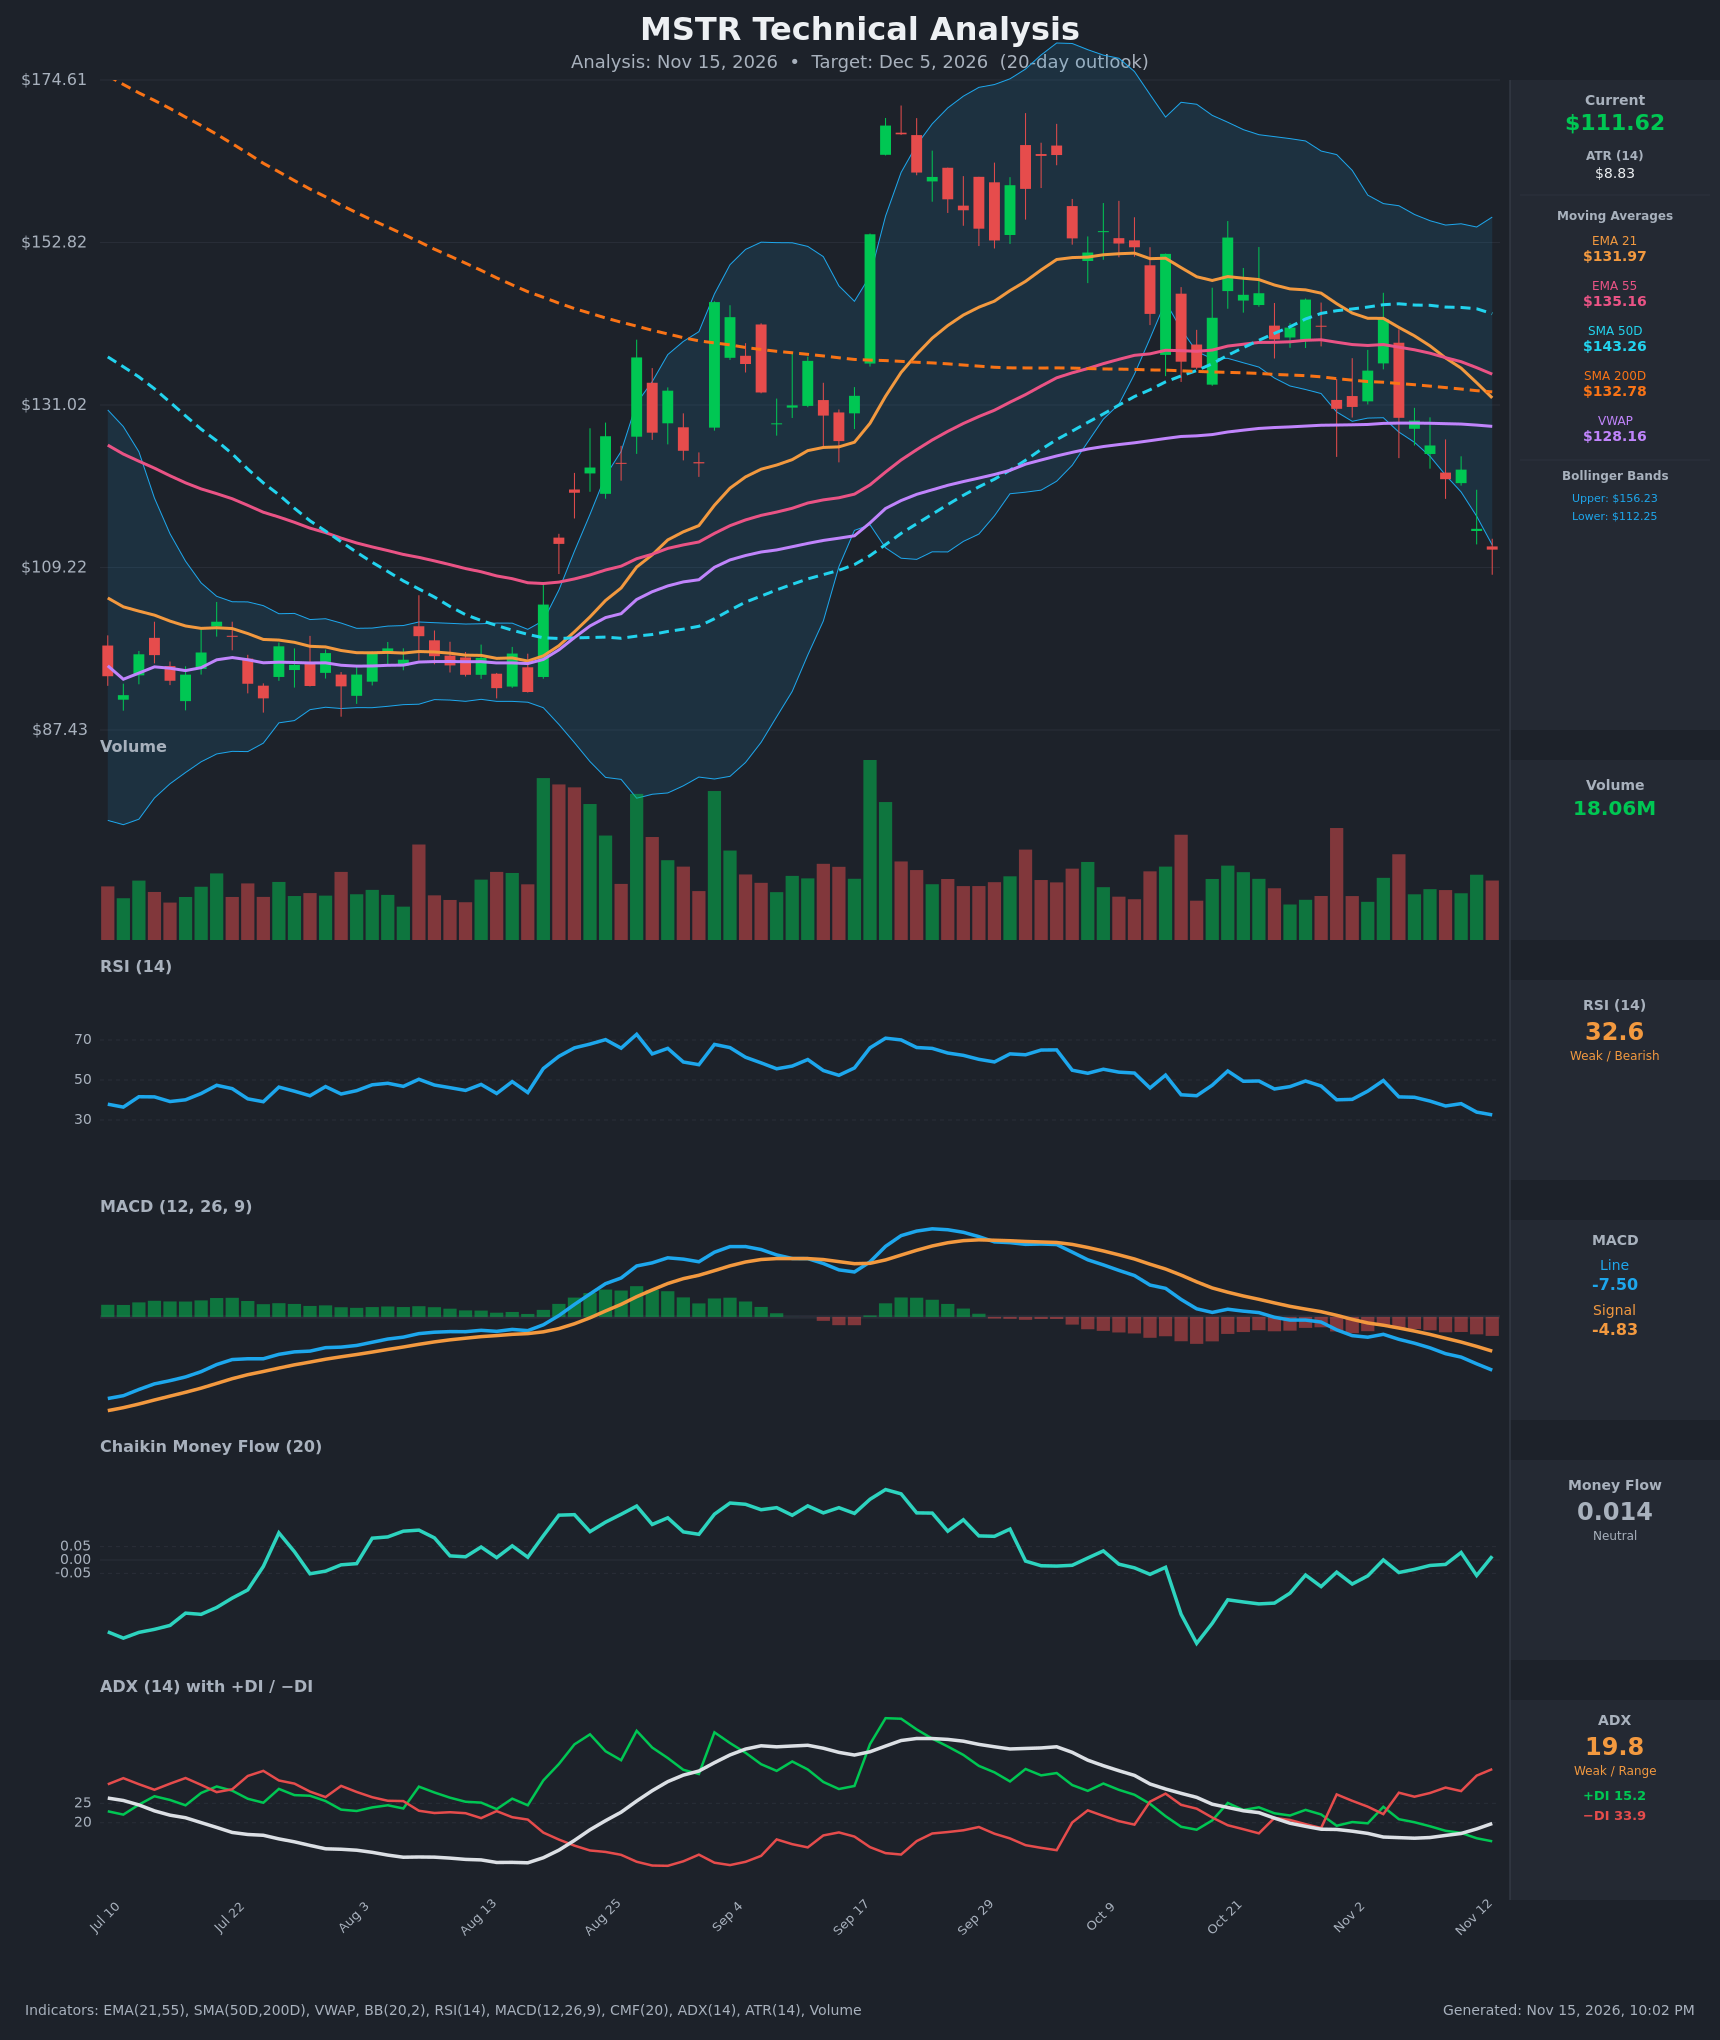
Analysis
TECHNICAL INDICATORS
- RSI (14): 32.57, falling steadily from about 50 on Nov 4 and making lower lows, now just above the 30 oversold line. Momentum is clearly down, though a bounce becomes more likely near 30. [Bearish]
- 20 EMA (EMA 21): $131.97. Price at $111.62 is about 15% below it, and the EMA is sloping down steeply, so it acts as heavy overhead resistance. EMA21 crossed below EMA55 ($135.16) on Nov 10, a short-term bearish crossover. [Bearish]
- MACD: Line -7.50 is below Signal -4.83, with the histogram negative and widening. The bearish crossover happened around Nov 2, and the gap keeps expanding, so downside momentum is accelerating. [Bearish]
- Bollinger Bands (20): Upper $156.23, lower $112.25. Price is sitting at or just under the lower band, so the stock is statistically stretched. Bands are wide after the September volatility. A walk down the lower band signals trend pressure, but a close back inside would hint at a relief bounce. [Bearish]
- CMF (20): 0.014, in the neutral zone (between -0.05 and +0.05). It has recovered from the October trough near -0.16 and is not confirming selling pressure. This is a mild positive divergence from price. [Neutral]
- ADX (14): 19.8 and rising from about 16, with −DI (33.9) far above +DI (15.2). The trend is not yet strong (below 25), but it is gaining strength in the bears' favor. [Weak but strengthening trend – Bearish]
- Volume: 18.06M, in line with or slightly below recent averages, with no capitulation spike. The decline is orderly rather than panicked, so a washout low is probably not yet in. [Neutral-to-Bearish]
Other levels:
- Price is below VWAP ($128.16) and below SMA200D ($132.78).
- SMA50D ($143.26) is still above SMA200D, so there is no death cross yet, but SMA50D has turned down and a cross is plausible if weakness continues.
DIVERGENCES & TRENDS
- Price vs RSI/MACD: There is no bullish divergence in RSI or MACD. Both are making new lows alongside price, which confirms the downtrend.
- CMF: It is holding near zero while price falls to new lows. This is a minor bullish divergence suggesting selling is not aggressive, but it is not a reversal signal on its own.
- Moving averages: Price lost EMA21, EMA55, VWAP, SMA50D and SMA200D in sequence from late October to mid-November. EMA21 crossed below EMA55 on Nov 10.
- DI: −DI crossed above +DI on Oct 30 and has widened since. ADX is turning up from the range-bound zone, so a new bearish trend is developing.
- Structure: Price has fallen from the ~$170 peak in mid-September, with a lower high near $155 in October and now a lower low below $112. This is a clear downtrend.
CHART PATTERNS
- There is no clean textbook pattern. The closest reference is a Bearish Head and Shoulders–style topping structure (September peak, lower October high), with the break of the ~$130 area acting like a neckline break. This is loose, not a textbook formation.
- The recent decline resembles a steady descending channel, which is a bearish continuation structure. A Bearish Flag would form if price consolidates briefly near $112–$122 and then breaks down.
- Targets: The prior consolidation base from July to mid-August sits at roughly $95–$105, so a measured move leads toward the $100–$105 area. The Aug 13 breakout zone around $105–$109 is the first support shelf.
POTENTIAL SCENARIOS
- Scenario 1: Bearish Trend Continuation — Price keeps walking the lower Bollinger Band with −DI dominant and MACD widening, then tests the old breakout shelf. Trigger: daily close below $108–$109. Target: $100–$105. Invalidation: daily close above $122 (reclaiming the Nov 10–11 closes). (50% probability)
- Scenario 2: Bullish Oversold Relief Bounce — RSI near 30, price at the lower band and neutral CMF set up a mean-reversion rally toward the falling EMAs, which would then act as resistance. Trigger: close back inside the Bollinger Bands and above $114.41, with RSI turning up. Target: $121–$128 (VWAP at $128.16). Invalidation: close below $105. (35% probability)
- Scenario 3: Neutral Basing Range — Price stabilizes with weak ADX and chops between roughly $105 and $120 as selling fades. Trigger: several sideways closes with RSI flat around 30–40. Target: $108–$117. Invalidation: a decisive break of either boundary. (15% probability)
PRICE TARGETS
Range width check: $112.00 − $99.50 = $12.50, which is 11.2% of $111.62. That is within the ~8–12% guidance for a 14–21 day horizon and is wider than any 2–3 day range would be.
- Target Price: $106.00 (20 trading days, around Dec 5, 2026)
- Expected Range: $99.50 to $112.00
- Key Levels: Support at $105.00 (first minor support near $109), Resistance at $121.07
OVERALL BIAS
OVERALL BIAS: BEARISH - Price is below all key moving averages and VWAP, with −DI far above +DI, a widening bearish MACD and falling RSI. The neutral CMF and the oversold, lower-band position raise the risk of a bounce, but trend evidence favors a drift toward the $100–$106 area.
This is educational analysis and not financial advice.