MSTR 34-day bearish forecast — Nov 15, 2026
- Bias: Bearish
- Timeframe: 34 days (made Nov 15, 2026, target date Dec 18, 2026)
- Price at analysis: $111.62
- Price target: $104.00
- Expected range: $91.00 – $124.50
- Result: Pending — graded after the close on Dec 18, 2026
Get a free AI analysis of MSTR today
Analysis
TECHNICAL INDICATORS
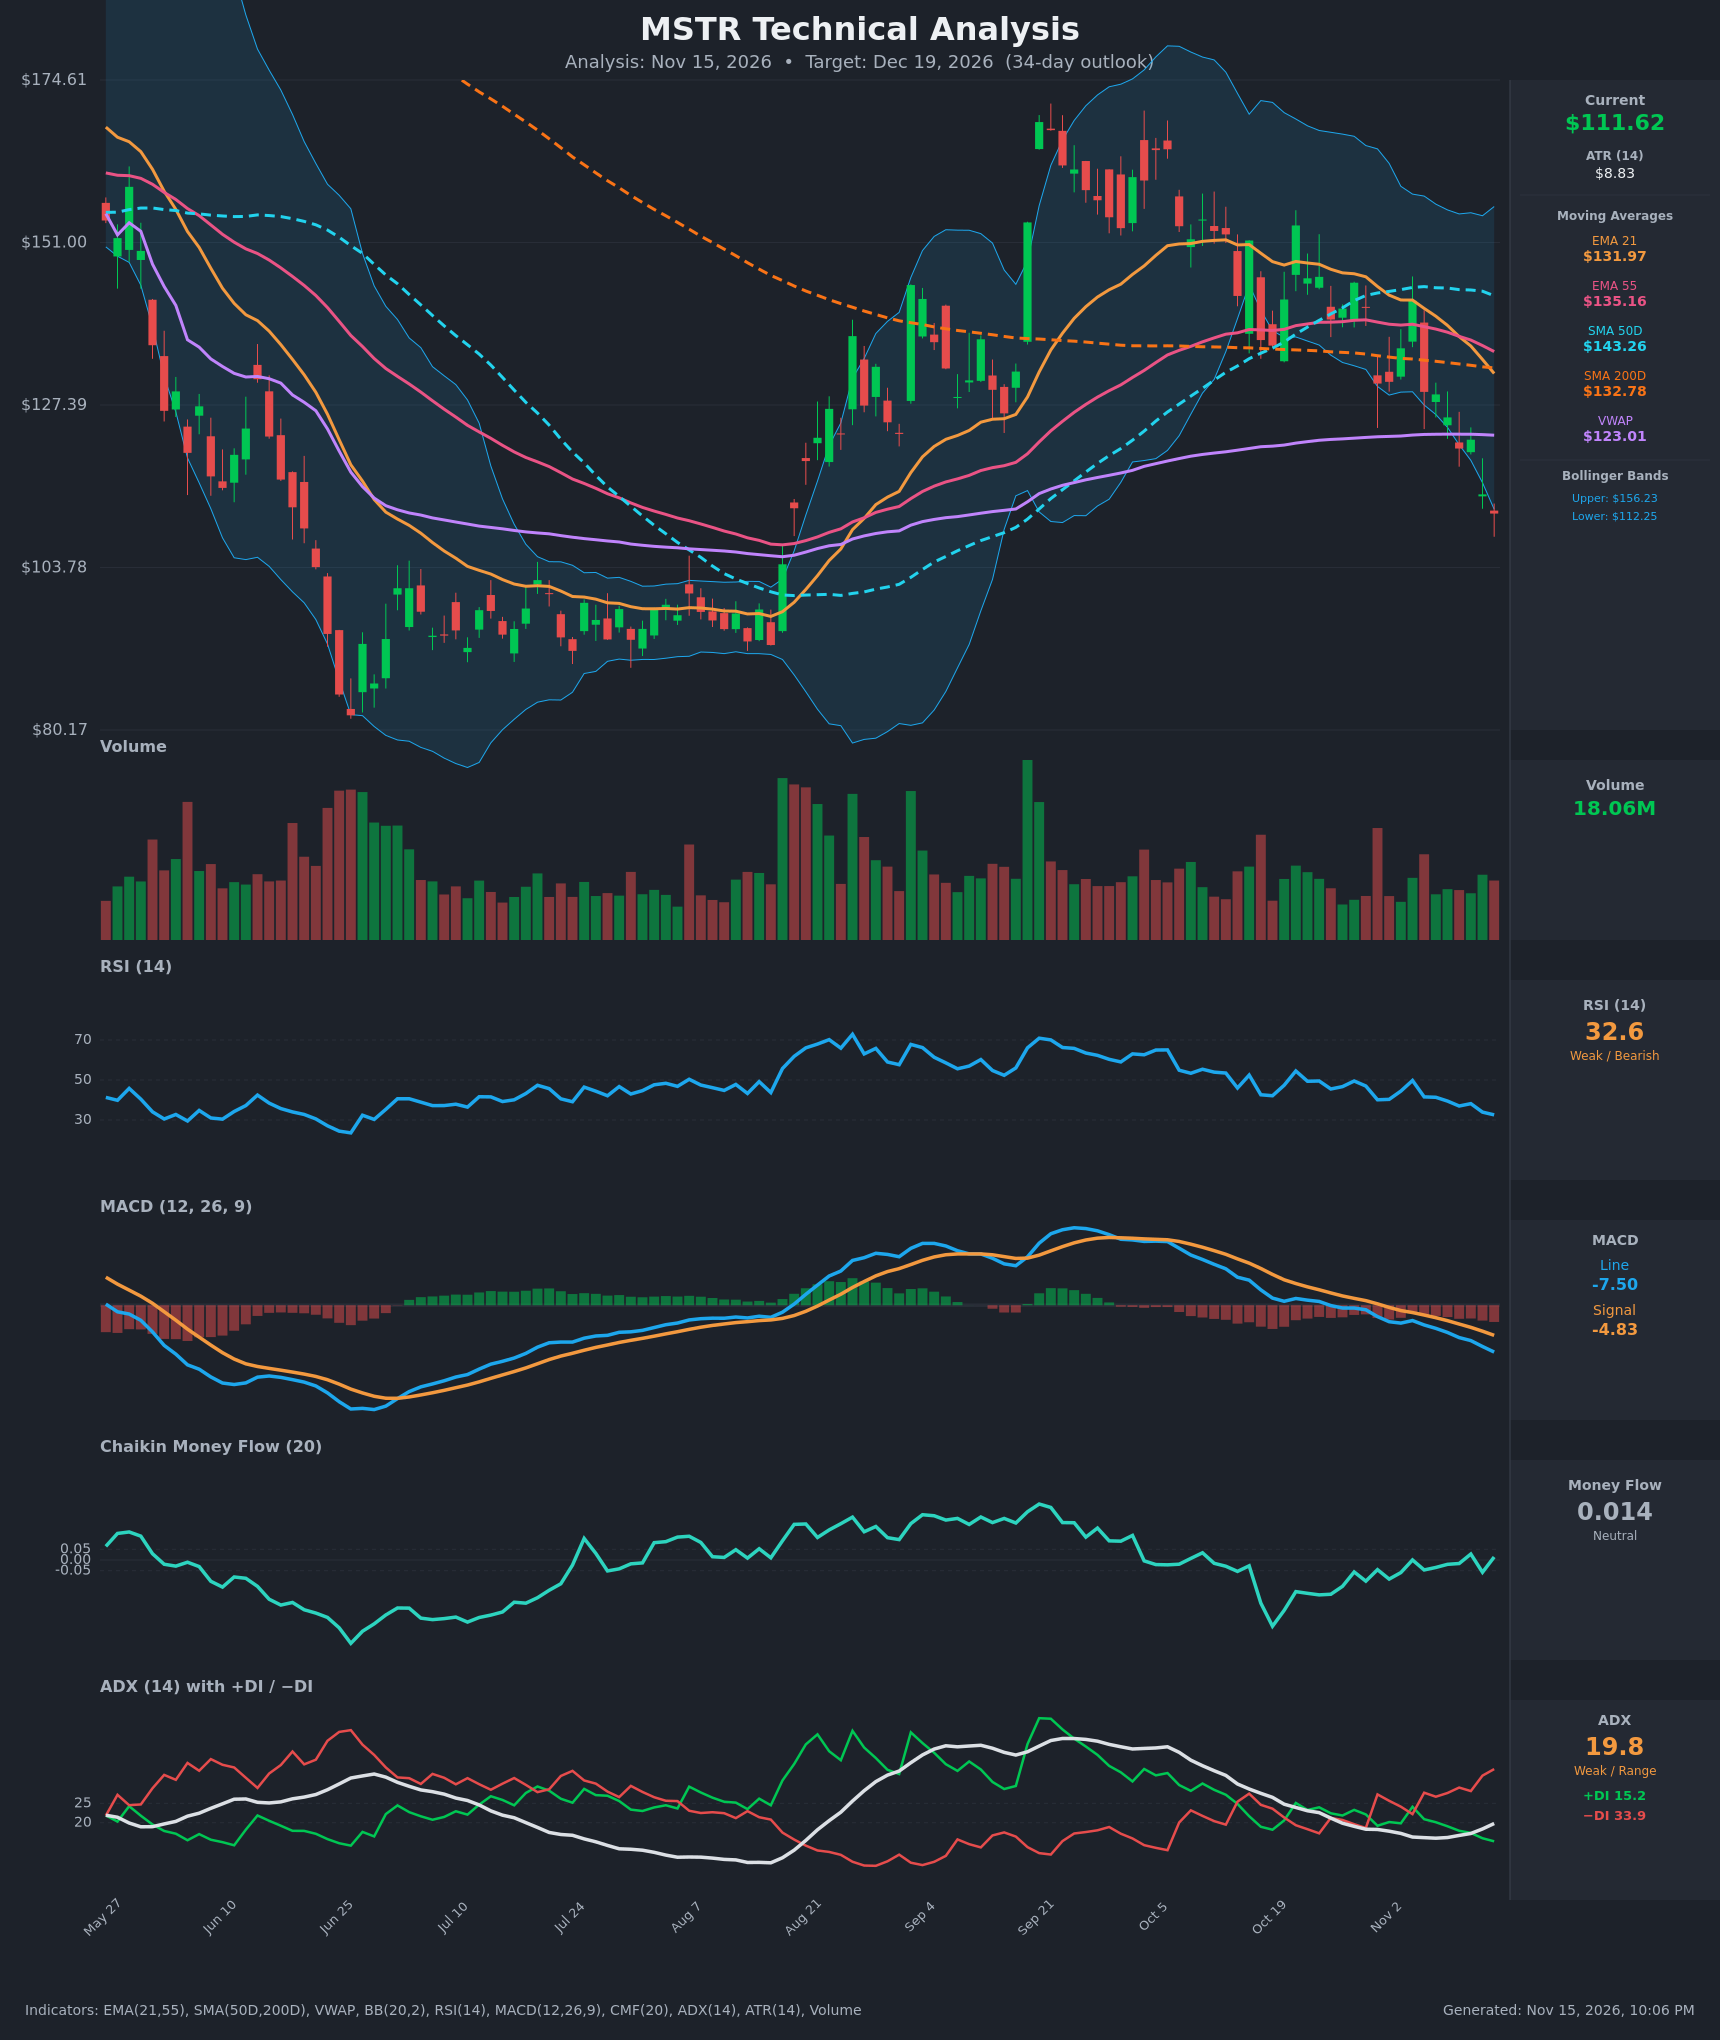
- RSI (14): 32.57, falling steadily from ~50 in early November and sitting just above the oversold line at 30. Momentum is clearly down, but not yet at an extreme. [Bearish]
- 20 EMA: The chart shows EMA 21 at $131.97 (EMA 55 at $135.16). Price at $111.62 is about 15% below EMA 21, so both EMAs act as overhead resistance. EMA 21 crossed below EMA 55 around Nov 10, a bearish crossover. [Bearish]
- MACD: Line -7.50 is below signal -4.83, and the histogram is negative and widening (about -2.7). The bearish crossover happened in early November and the gap keeps growing. [Bearish]
- Bollinger Bands (20): Upper $156.23, lower $112.25. Price at $111.62 is just below the lower band, a band-walk or an oversold extension. The bands are wide, so volatility is elevated. Closes below the lower band often precede a snap-back toward the midline (about $134), but in strong downtrends price can keep riding the band. [Bearish] (short-term oversold, with a bounce risk)
- CMF (20): 0.014, inside the ±0.05 neutral zone. It has recovered from earlier negative readings (-0.16) without showing real accumulation. There is no confirmed buying or selling pressure, though the lack of heavy distribution on this sell-off is a mild positive. [Neutral]
- ADX (14): 19.8 with −DI (33.9) far above +DI (15.2). The ADX is below 25 but rising from 16, so the trend is still weak by the numbers while the bears clearly dominate. The DI spread of about 19 points is the more telling signal. [Weak Trend, Bearish Direction]
- Volume: 18.06M, around average with no obvious capitulation spike on the latest bars. Selling is orderly rather than panicked. Without a volume climax, a durable bottom is less likely to be in. [Neutral to Mildly Bearish]
DIVERGENCES & TRENDS
- Divergences: There is no bullish RSI divergence yet. RSI is making lower lows along with price (RSI went from 49.7 on Nov 4 to 32.6). CMF is flat to slightly higher while price falls, a minor positive divergence that needs confirmation.
- Trends: Price fell from about $145 (Oct 28) to $111.62 (Nov 13), a drop of roughly 23% in 12 sessions. MACD and RSI are both trending down. −DI has overtaken +DI since Oct 30 and the gap is widening.
- Crossovers and breaks:
- EMA21 crossed below EMA55 (Nov 10-11).
- SMA50D ($143.26) is well above SMA200D ($132.78), so there is no death cross yet. But the SMA50D is rolling over, and the EMA21 is falling toward the SMA200D.
- Price broke below the SMA200D (~$132.8) and VWAP ($123.0), a loss of key support that is now resistance.
- Price is trading below the lower Bollinger Band, sitting at the edge of the structure's low.
- The Jun-Aug base around $90-$105 is the next major support zone.
CHART PATTERNS
- Bearish continuation / breakdown: A lower-high sequence from the Sep peak ($165-170) through Oct and into November, ending with a breakdown below the SMA200D and VWAP. This looks like a Bearish Head and Shoulders / Double Top style reversal from the Sep-Oct highs. The neckline is roughly $130-$135 (the Oct-Nov consolidation lows). The measured move, with the head near $168 and the neckline near $132, is about $36 and points to roughly $96-$100.
- Bullish counterpoint: The Jun-Aug base ($90-$105) is a possible Bullish Double Bottom / rounding base area, and it is the likely support if the decline continues. An oversold RSI near 32 and a close under the lower band raise the odds of a relief bounce, which would be a retest of the broken $120-$132 zone, not a trend reversal.
- Significance: The measured move to about $96-$100 is the bearish target. A bounce into the $123-$132 band would likely be sold, since VWAP, SMA200D and EMA21 cluster there.
POTENTIAL SCENARIOS
- Scenario 1: Bearish Continuation Toward the Summer Base — −DI dominance, a widening MACD gap and the head-and-shoulders measured move point to further downside after a brief bounce fails. Trigger: price fails at VWAP ($123) or rejects below $118-$120, then breaks below $108. Target: $96-$100, with an extreme of $90. Invalidation: daily close above $124 (VWAP). (50% probability)
- Scenario 2: Bullish Oversold Relief Bounce — RSI near 30 and a close below the lower Bollinger Band set up a mean-reversion rally toward the overhead moving-average cluster. Trigger: bullish reversal candle with a volume spike above $115, and RSI turning up above 35. Target: $123-$132 (VWAP to SMA200D). Invalidation: close below $105. (35% probability)
- Scenario 3: Neutral Basing Range — Price stabilizes between $100 and $120 as ADX stays under 20. Trigger: several sessions of tight ranges with no new lows. Target: $105-$118 range. Invalidation: close outside the $100-$120 range. (15% probability)
PRICE TARGETS
For a 34-day timeframe the range width should be about 12-18% of price, and mine is slightly wider (~21%) because of high volatility (ATR $8.83, about 7.9% of price).
- Target Price: $104.00 (34 days; bearish drift, about 6.8% below current price, a partial move toward the $96-$100 measured target after a relief bounce)
- Expected Range: $91.00 to $124.50 (width $33.50, about 30% of current price)
- Key Levels: Support at $103.78 (then the $90-$95 summer base), Resistance at $123.00 (VWAP; then $132.78 SMA200D)
OVERALL BIAS
OVERALL BIAS: BEARISH - Price is below every major moving average and VWAP, −DI far exceeds +DI, and MACD and RSI are in downtrends with a bearish EMA crossover, so a continued decline toward the $96-$104 area is more likely than a full recovery. The oversold reading and lower-band close do raise the odds of a bounce, which would probably be capped near $123-$132.
This is educational analysis and not financial advice.