MSTR 48-day bearish forecast — Nov 15, 2026
- Bias: Bearish
- Timeframe: 48 days (made Nov 15, 2026, target date Jan 1, 2027)
- Price at analysis: $111.62
- Price target: $106.00
- Expected range: $96.00 – $115.00
- Result: Pending — graded after the close on Jan 1, 2027
Get a free AI analysis of MSTR today
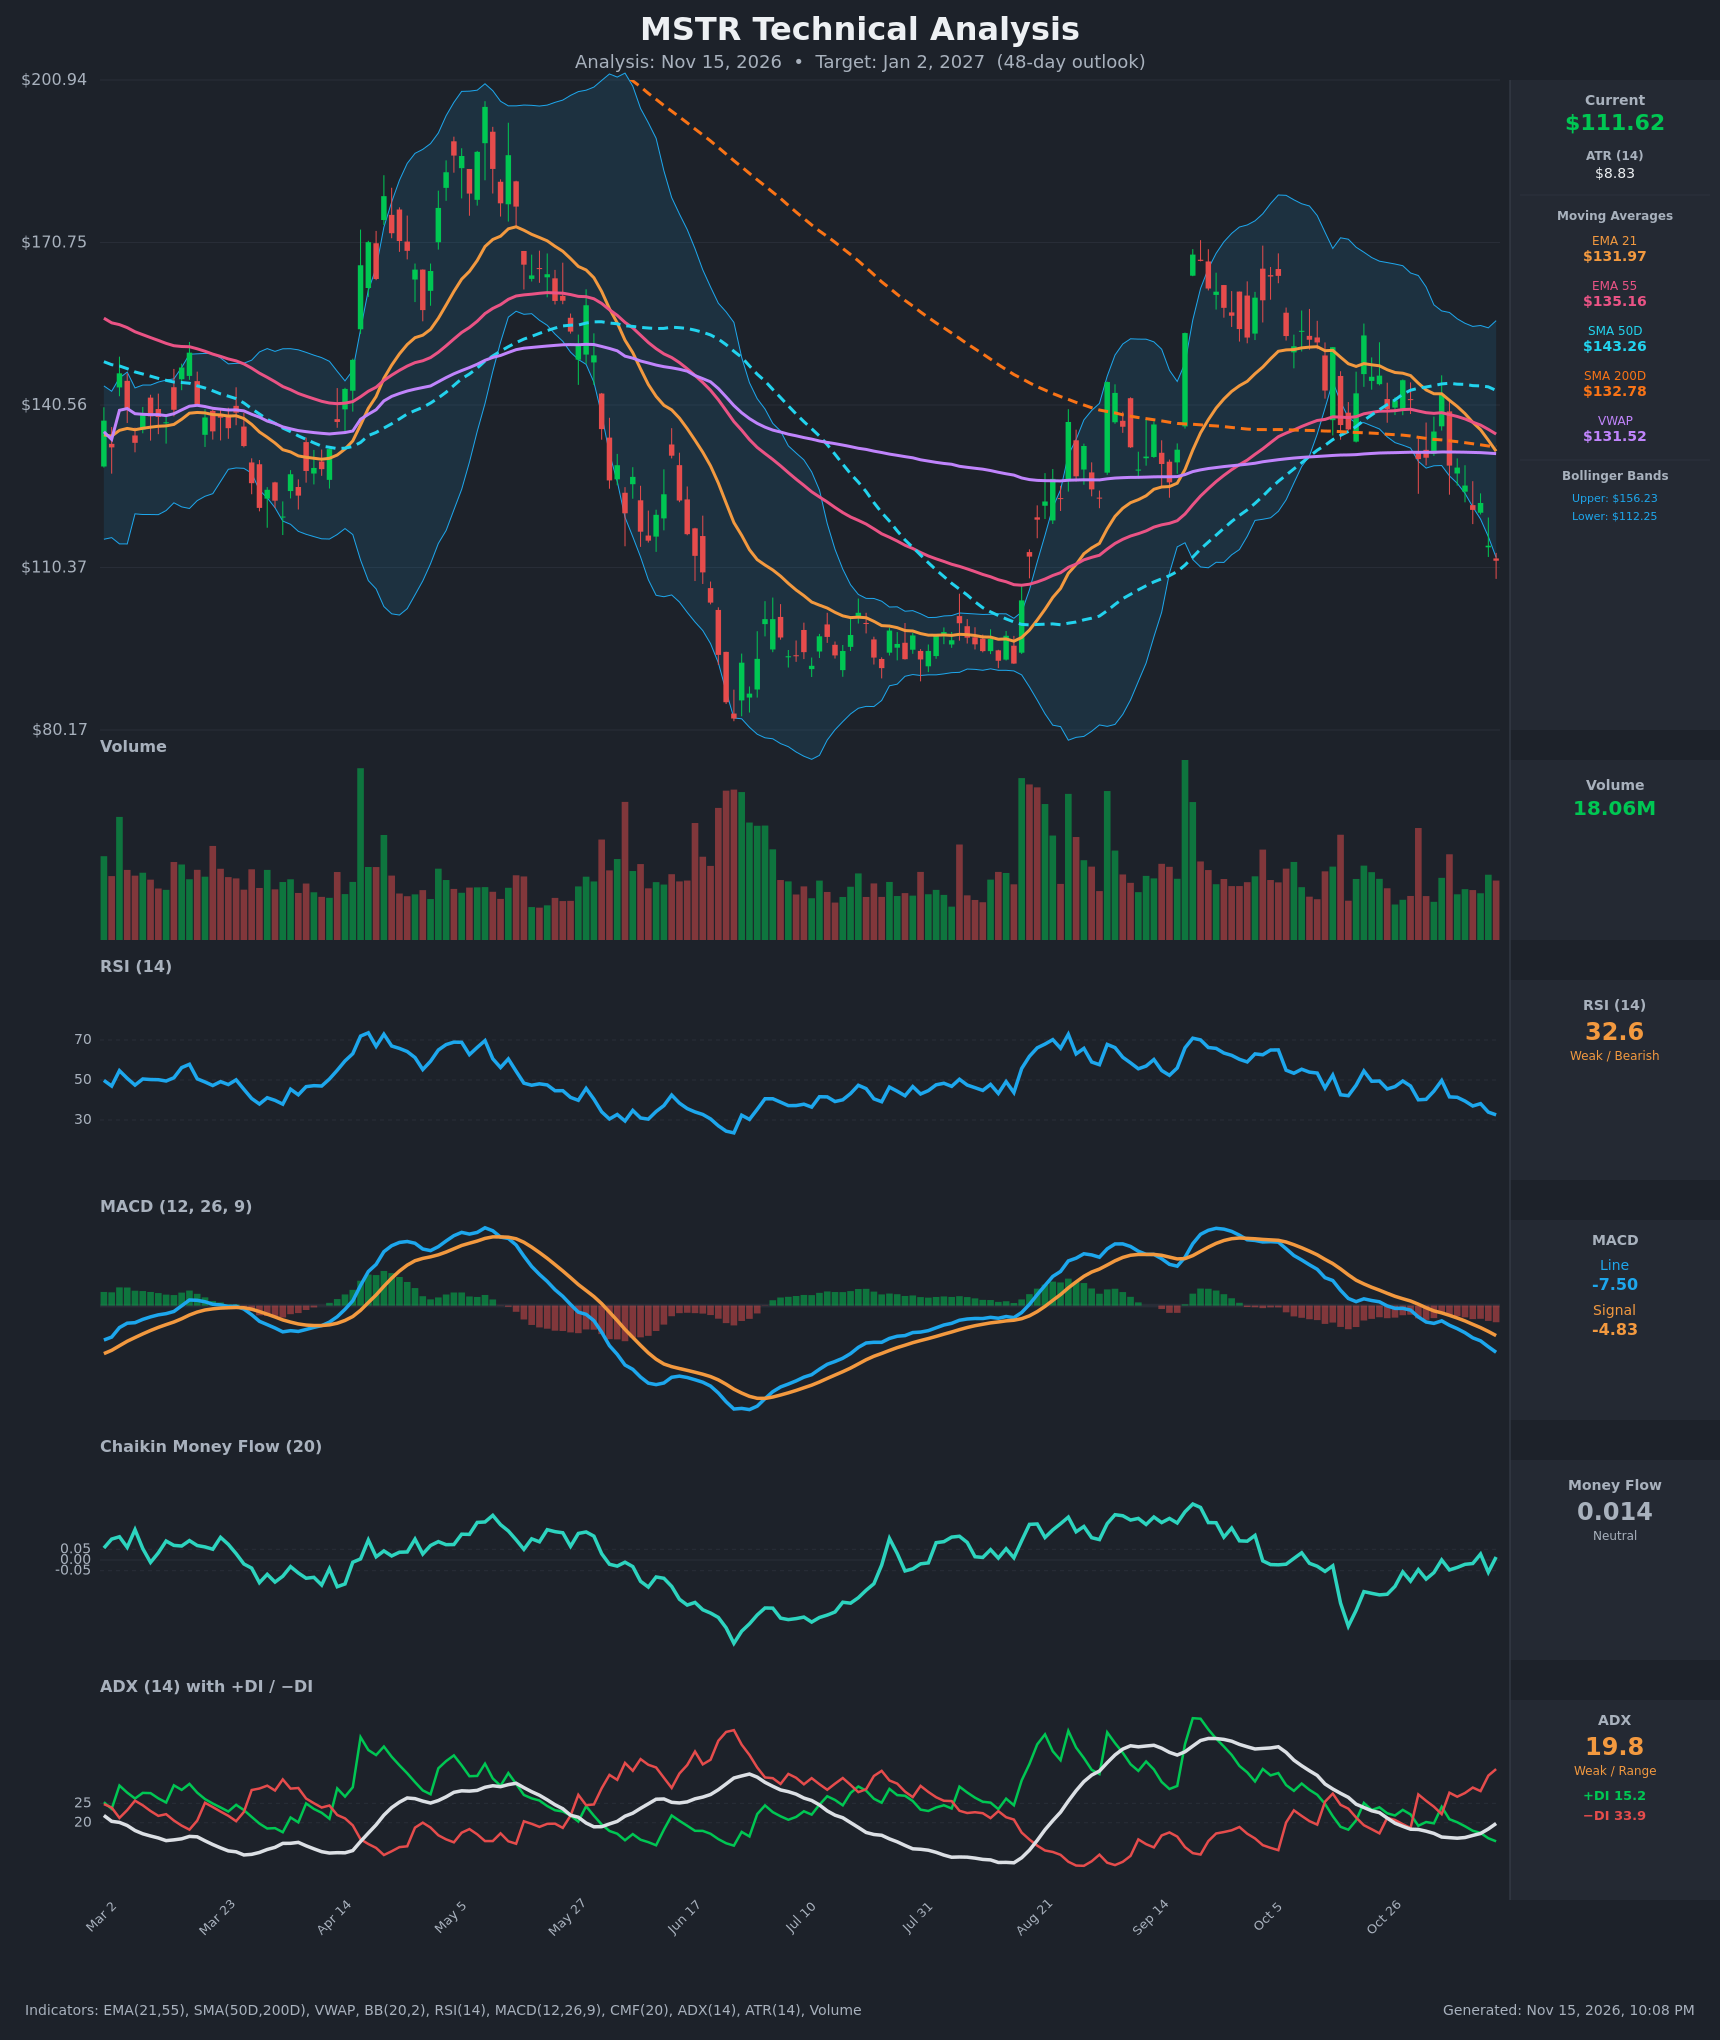
Analysis
TECHNICAL INDICATORS
- RSI (14): 32.57, just above the 30 oversold line and falling from ~50 on Nov 4. Momentum is clearly down, with no bullish divergence yet. The June washout hit the mid-20s, so there is room to fall further. [Bearish]
- 20 EMA (EMA 21): $131.97, with price (~$111.62) about 15% below it. EMA21 has also crossed below EMA55 ($135.16), so the average acts as overhead resistance. [Bearish]
- MACD: Line -7.50 is below the signal at -4.83. The bearish crossover happened around Nov 2, and the gap and histogram keep widening with no sign of a turn. [Bearish]
- Bollinger Bands (20): Upper $156.23, lower $112.25. Price is at or slightly below the lower band after a sharp expansion, a "walking the band" move in a downtrend. This is stretched and raises the odds of a relief bounce, but it is not a reversal signal by itself. [Bearish]
- CMF (20): 0.014, inside the neutral zone (±0.05). It has hovered near zero through the decline and is slightly better than the -0.16 of late October, so there is no heavy distribution. It is a mild positive divergence, not enough to override the trend. [Neutral]
- ADX (14): 19.8, below the 20 line, but it is turning up from 16 while −DI (33.9) is far above +DI (15.2). The trend is early-stage and strengthening, with bears in control. [Weak but Strengthening Trend – Bearish]
- Volume: 18.06M, moderate and in line with recent averages. There is no capitulation spike like the large-volume washouts at the June and August turning points, so selling has not been exhausted. [Neutral-to-Bearish: no capitulation yet]
DIVERGENCES & TRENDS
- Price vs RSI/MACD: Both are making new lows with price, so there is no bullish divergence and the downtrend is confirmed.
- CMF: Money flow is flat near zero while price drops. This is a mild bullish divergence and a reason for a bounce, but it is not a signal.
- Moving averages: Price is below EMA21, EMA55, SMA50D ($143.26), SMA200D ($132.78) and VWAP ($131.52). The EMA21/EMA55 bearish cross occurred around Nov 10–11. SMA50D is still above SMA200D, but SMA50D is rolling over and the gap is closing, so a death cross is possible in coming weeks.
- DI: −DI crossed above +DI on Oct 30 and the spread has widened to ~19 points, with ADX rising. Bearish control is strengthening.
- Structure: Lower highs from the ~$200 peak, to ~$170 in September, to ~$145 in late October. The decline has taken price from the $125–130 consolidation floor to ~$111.
CHART PATTERNS
- Bearish rectangle / descending-triangle-style breakdown: Price consolidated roughly $125–$145 in late October and early November, then broke the $125–130 floor. The measured move (range height ~$20 projected from ~$125) points to about $105.
- Lower-high structure: The September high of ~$170 failed well below the ~$200 peak. It is not a clean Double Top, but it is consistent with a bearish reversal of the larger trend.
- Possible base: The $83–$100 zone from June to August was a prior accumulation base and is the major downside support if the breakdown extends.
- Targets: Pattern target ~$105, with an extension to the $95–$100 area.
POTENTIAL SCENARIOS
- Scenario 1: Bearish Breakdown Continuation — The downtrend continues after the break of the $125–130 floor. Price is below all moving averages, −DI dominates and ADX is rising. Trigger: failure to reclaim $118–$122 and a close below $108. Target: $98–$104, with a stretch to ~$95 (top of the June–Aug base). Invalidation: daily close above $122, then $132 (EMA21). (50% probability)
- Scenario 2: Bullish Oversold Relief Rally — RSI near 30, price at the lower Bollinger Band and neutral-to-improving CMF set up a mean-reversion bounce back toward the falling moving averages. Trigger: RSI turns up above 35 and MACD histogram stops falling. Target: $125–$132 (EMA21/VWAP/SMA200D cluster). Invalidation: close below $104 without a bounce. (30% probability)
- Scenario 3: Neutral Base Building — Price stabilizes above the prior base and chops between support and the falling moving averages while ADX stays weak. Trigger: several sessions of tight closes with volume contraction. Target: $105–$118. Invalidation: close below $100 or above $125. (20% probability)
PRICE TARGETS
- Target Price: $106.00 (48 days, Jan 2, 2027)
- Expected Range: $96.00 to $115.00 (width $19 ≈ 17% of current price, in line with the 30–60 day guidance)
- Key Levels: Support at $100.00, Resistance at $122.00
OVERALL BIAS
OVERALL BIAS: BEARISH - Price is below every moving average, MACD is falling below its signal, and −DI (33.9) dominates +DI (15.2) with ADX turning up. The breakdown below the $125–130 range projects to about $105, though the oversold RSI and lower Bollinger Band argue for a bounce along the way.
This is educational analysis and not financial advice.