MSTR 6-day bearish forecast — Nov 1, 2026
- Bias: Bearish
- Timeframe: 6 days (made Nov 1, 2026, target date Nov 6, 2026)
- Price at analysis: $130.53
- Price target: $128.00
- Expected range: $123.80 – $132.80
- Result: Correct (-1.1%) — closed at $129.08 on Nov 6, 2026; quality score 100/100
Get a free AI analysis of MSTR today
Analysis
TECHNICAL INDICATORS
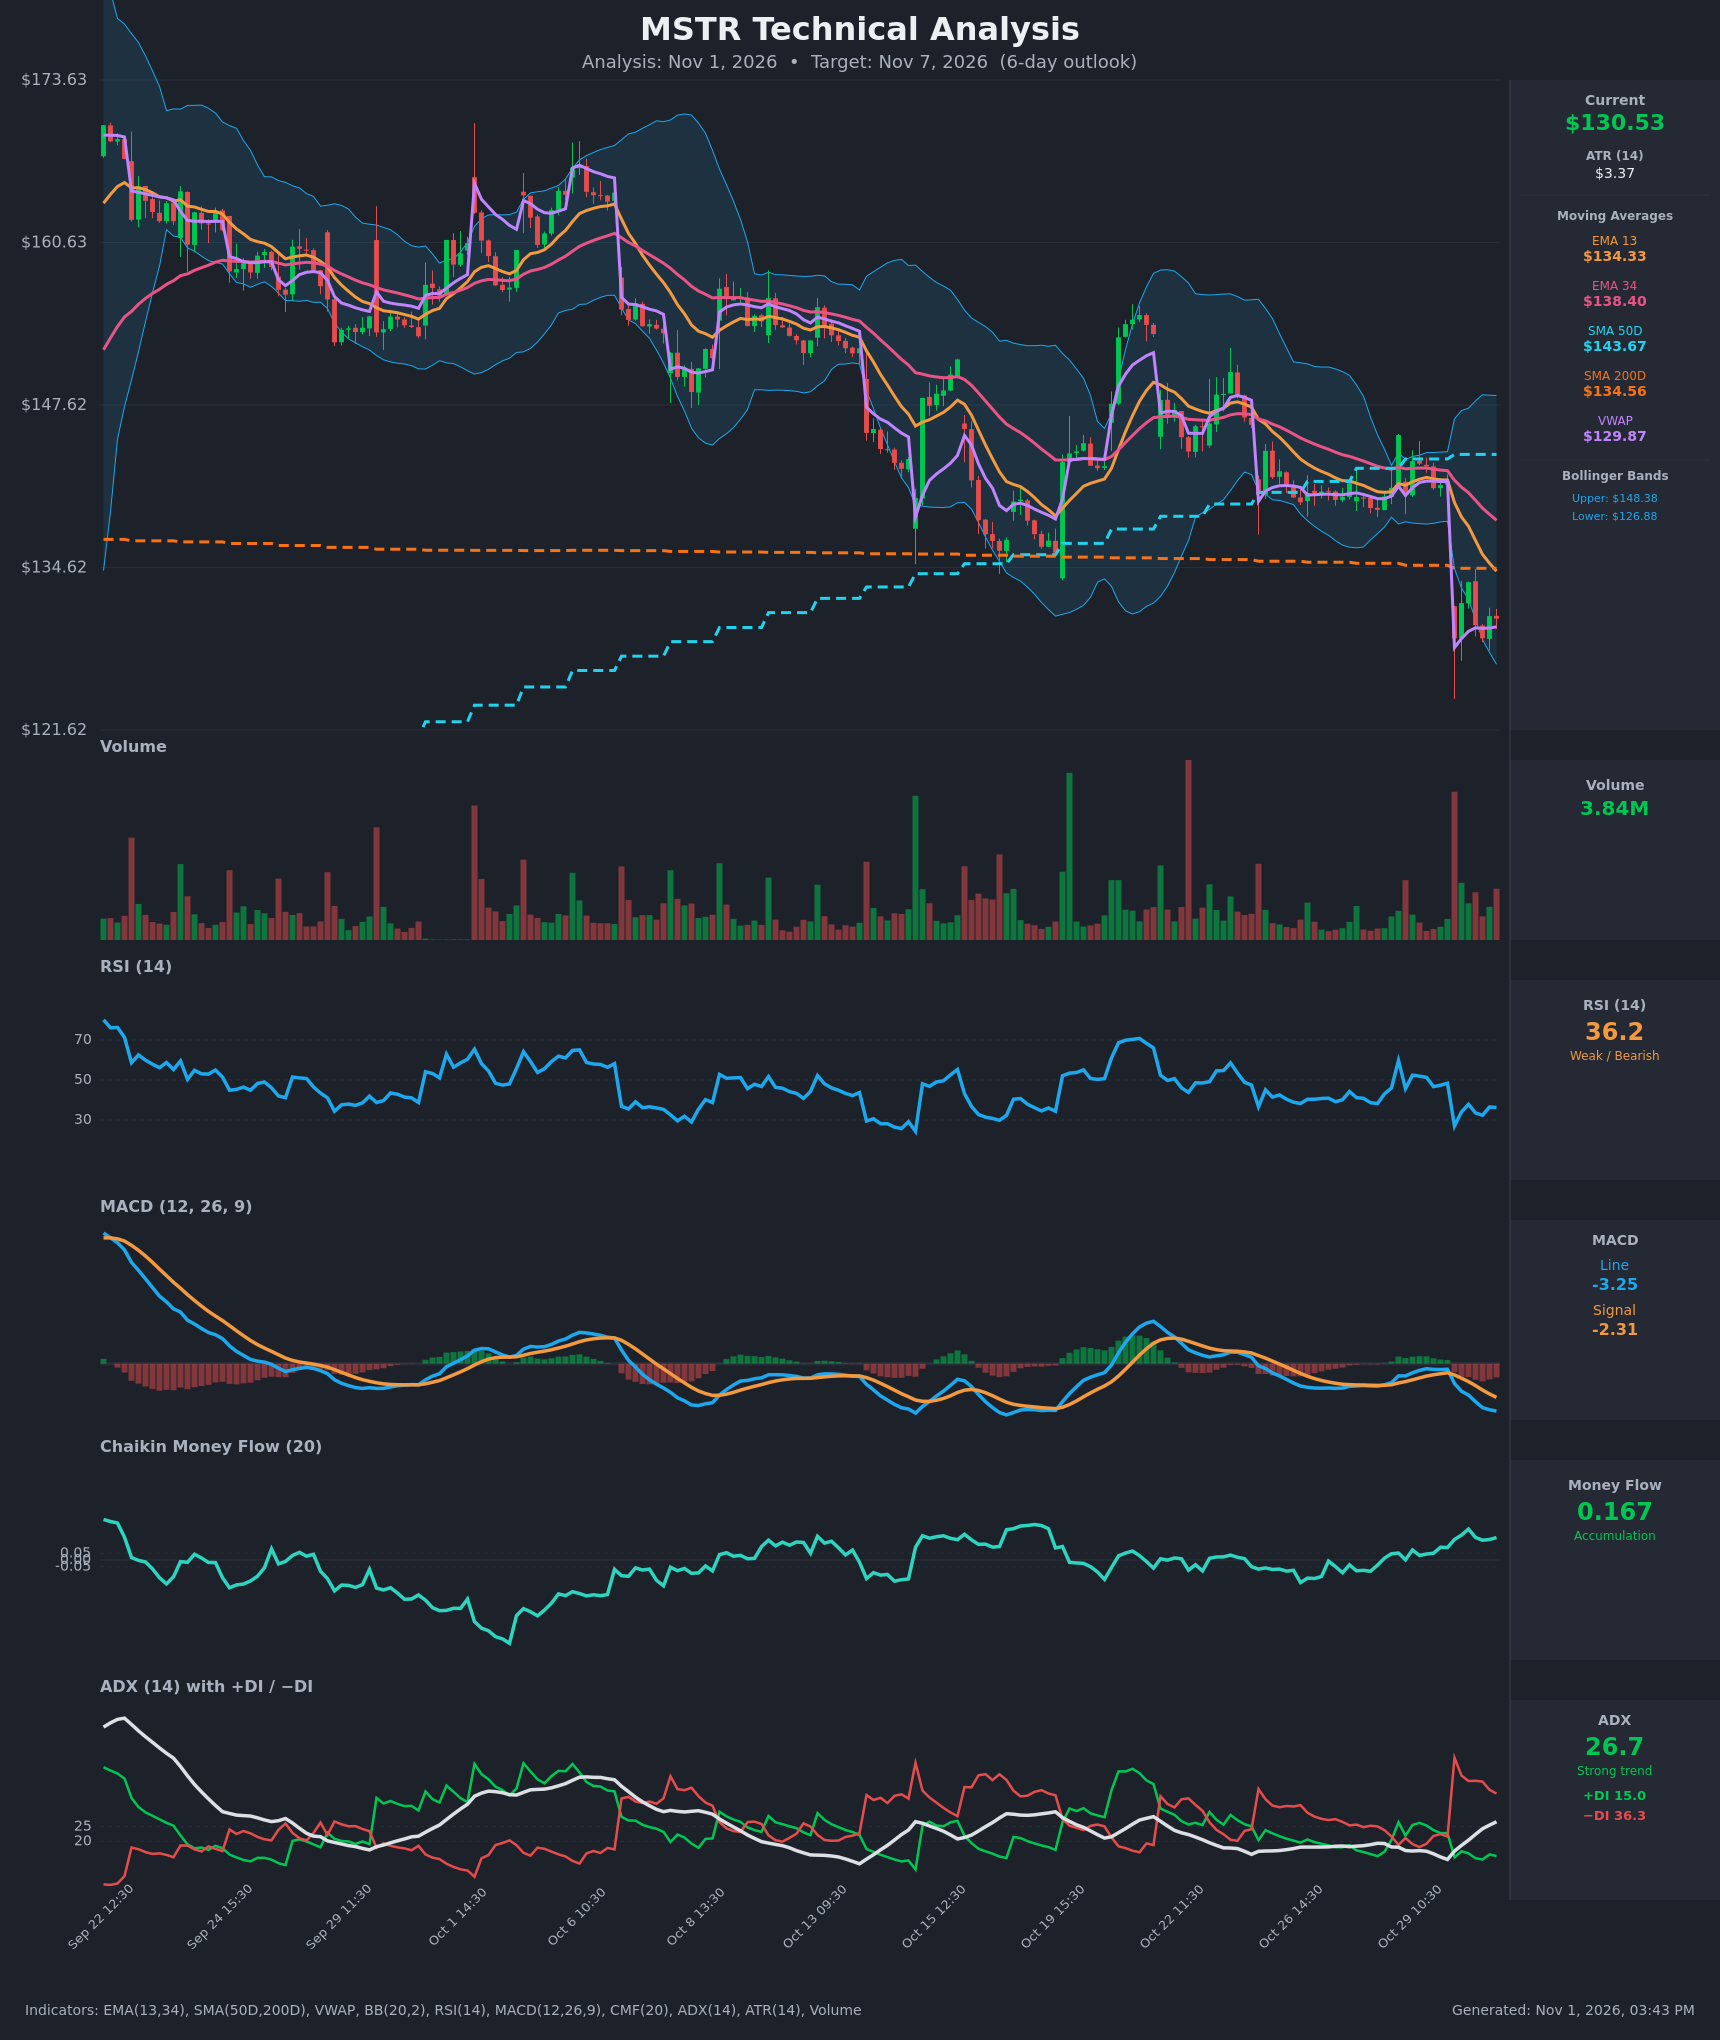
- RSI (14): 36.24, down from the high-40s/50s before the Oct 30 gap and near the 27 low at the open. It is close to oversold but has bounced only modestly, so momentum is still bearish with some room for a relief bounce. [Bearish]
- 20 EMA: The chart shows EMA 13 at $134.33 and EMA 34 at $138.40, both falling and above price. EMA13 is below EMA34, so the short-term trend is down and both act as overhead resistance. [Bearish]
- MACD: Line -3.25 is below Signal -2.31, with a negative and widening histogram. The bearish crossover happened on Oct 30 and the gap is still expanding. [Bearish]
- Bollinger Bands (20): Price is $130.53, in the lower third of the bands (upper $148.38, lower $126.88, midline about $137.6). Price is $3.65 above the lower band after a gap-and-walk down. The bands are wide, so volatility is elevated, and a test of the lower band is possible. [Bearish]
- CMF (20): 0.167, well above +0.05 and rising since mid-October. It is a bullish divergence against falling price, but the gap-down bars closed well off their lows, which may inflate it. It is a mild counterweight to the bearish trend. [Accumulation]
- ADX (14): 26.7 and rising, with −DI 36.3 far above +DI 15.0. This is a strong, strengthening downtrend with bears firmly in control. [Strong Trend – Bearish]
- Volume: 3.84M on the latest bar, after a spike on the Oct 30 gap-down. Later bars have faded and are still near average. The heavy selling volume on the breakdown confirms the move, and the fade suggests short-term exhaustion or digestion. [Bearish on breakdown, consolidating]
Other levels:
- SMA 50D at $143.67 is far overhead.
- SMA 200D at $134.56 was lost on the gap and is now resistance.
- VWAP at $129.87 is nearly flat with price, so it is a pivot level. Price holding just above it is a minor positive.
DIVERGENCES & TRENDS
- CMF vs price: CMF is rising and positive while price makes lower highs and lows. This is a bullish divergence, but it is not confirmed by price or RSI.
- RSI: It made no clear bullish divergence. The RSI low of about 27 at the gap came with a new price low, and RSI is now only recovering to the mid-30s.
- MACD: The bearish crossover is fresh, with the histogram deepening.
- ADX/DI: The −DI spike to 48 and the ADX rise from about 14 to 26.7 show a trend transition from range-bound to bearish. +DI has been crushed.
- Moving averages: Price is below EMA13, EMA34, SMA50 and now SMA200. EMA13 is below EMA34. The SMA50 is above the SMA200, so there is no death cross yet, but the gap between them is narrowing as price falls.
- Price action: Lower highs since the Sept 22 peak near $173. The Oct 30 gap below the SMA200 and the lower Bollinger Band zone is a decisive breakdown.
CHART PATTERNS
- Primary pattern: A broad descending sequence of lower highs and lower lows since late September, with a gap-down breakdown through the SMA200 and the October consolidation floor around $139–140.
- Post-gap consolidation: The small hourly range of about $129–$134 resembles a Bearish Flag/Pennant from the reference diagram. A break below about $128.50–$129 would project a measured move of roughly $10–12, toward $118–$120. That is beyond a 6-day horizon, but it sets the direction.
- Alternative: If price instead curls up from the lower band, a Bullish Falling Wedge or double-bottom base could form. Neither is confirmed.
- Resistance cluster: $134.33–$134.56 (EMA13 plus SMA200) is the first area where a bounce would be likely to stall.
POTENTIAL SCENARIOS
- Scenario 1: Bearish Flag Breakdown / Trend Continuation — Strong ADX with −DI dominance and a widening negative MACD favor a downside break from the post-gap consolidation, toward the lower Bollinger Band and the gap-day wick lows. Trigger: hourly close below $128.50 (the gap-day lows and VWAP area). Target: $126.90 (lower BB), then $124. Invalidation: close back above $134.60 (SMA200/EMA13). (50% probability)
- Scenario 2: Bullish Oversold Relief Bounce — RSI near oversold, price near the lower band and positive CMF accumulation could fuel a reflex rally to fill part of the gap. Trigger: break above $133.50 with rising volume. Target: $134.50–$137.50 (SMA200, EMA13, then the Bollinger midline). Invalidation: loss of $128.50. (32% probability)
- Scenario 3: Neutral Sideways Digestion — Price chops between VWAP/gap-day lows and the SMA200 while ADX flattens. Trigger: failure to break either $128.50 or $134.50. Target: $129.50–$132.50. Invalidation: a decisive close outside $128–$135. (18% probability)
PRICE TARGETS
Range width check: $132.80 − $123.80 = $9.00, which is about 6.9% of $130.53. This fits the guidance for a 6-day horizon.
- Target Price: $128.00 (6 days)
- Expected Range: $123.80 to $132.80
- Key Levels: Support at $126.88 (lower Bollinger Band), Resistance at $134.56 (SMA200/EMA13 zone)
OVERALL BIAS
OVERALL BIAS: BEARISH - The gap-down breakdown through the SMA200 came with a strong, rising ADX and −DI at 36 versus +DI at 15. MACD is bearish and widening, and price sits below all key moving averages. The positive CMF and near-oversold RSI argue for a possible relief bounce, but they are not enough to override the trend.
This is educational analysis and not financial advice.