IREN 6-day bearish forecast — Nov 1, 2026
- Bias: Bearish
- Timeframe: 6 days (made Nov 1, 2026, target date Nov 6, 2026)
- Price at analysis: $23.97
- Price target: $23.10
- Expected range: $21.60 – $25.30
- Result: Correct (-9.5%) — closed at $21.68 on Nov 6, 2026; quality score 77/100
Get a free AI analysis of IREN today
Analysis
TECHNICAL INDICATORS
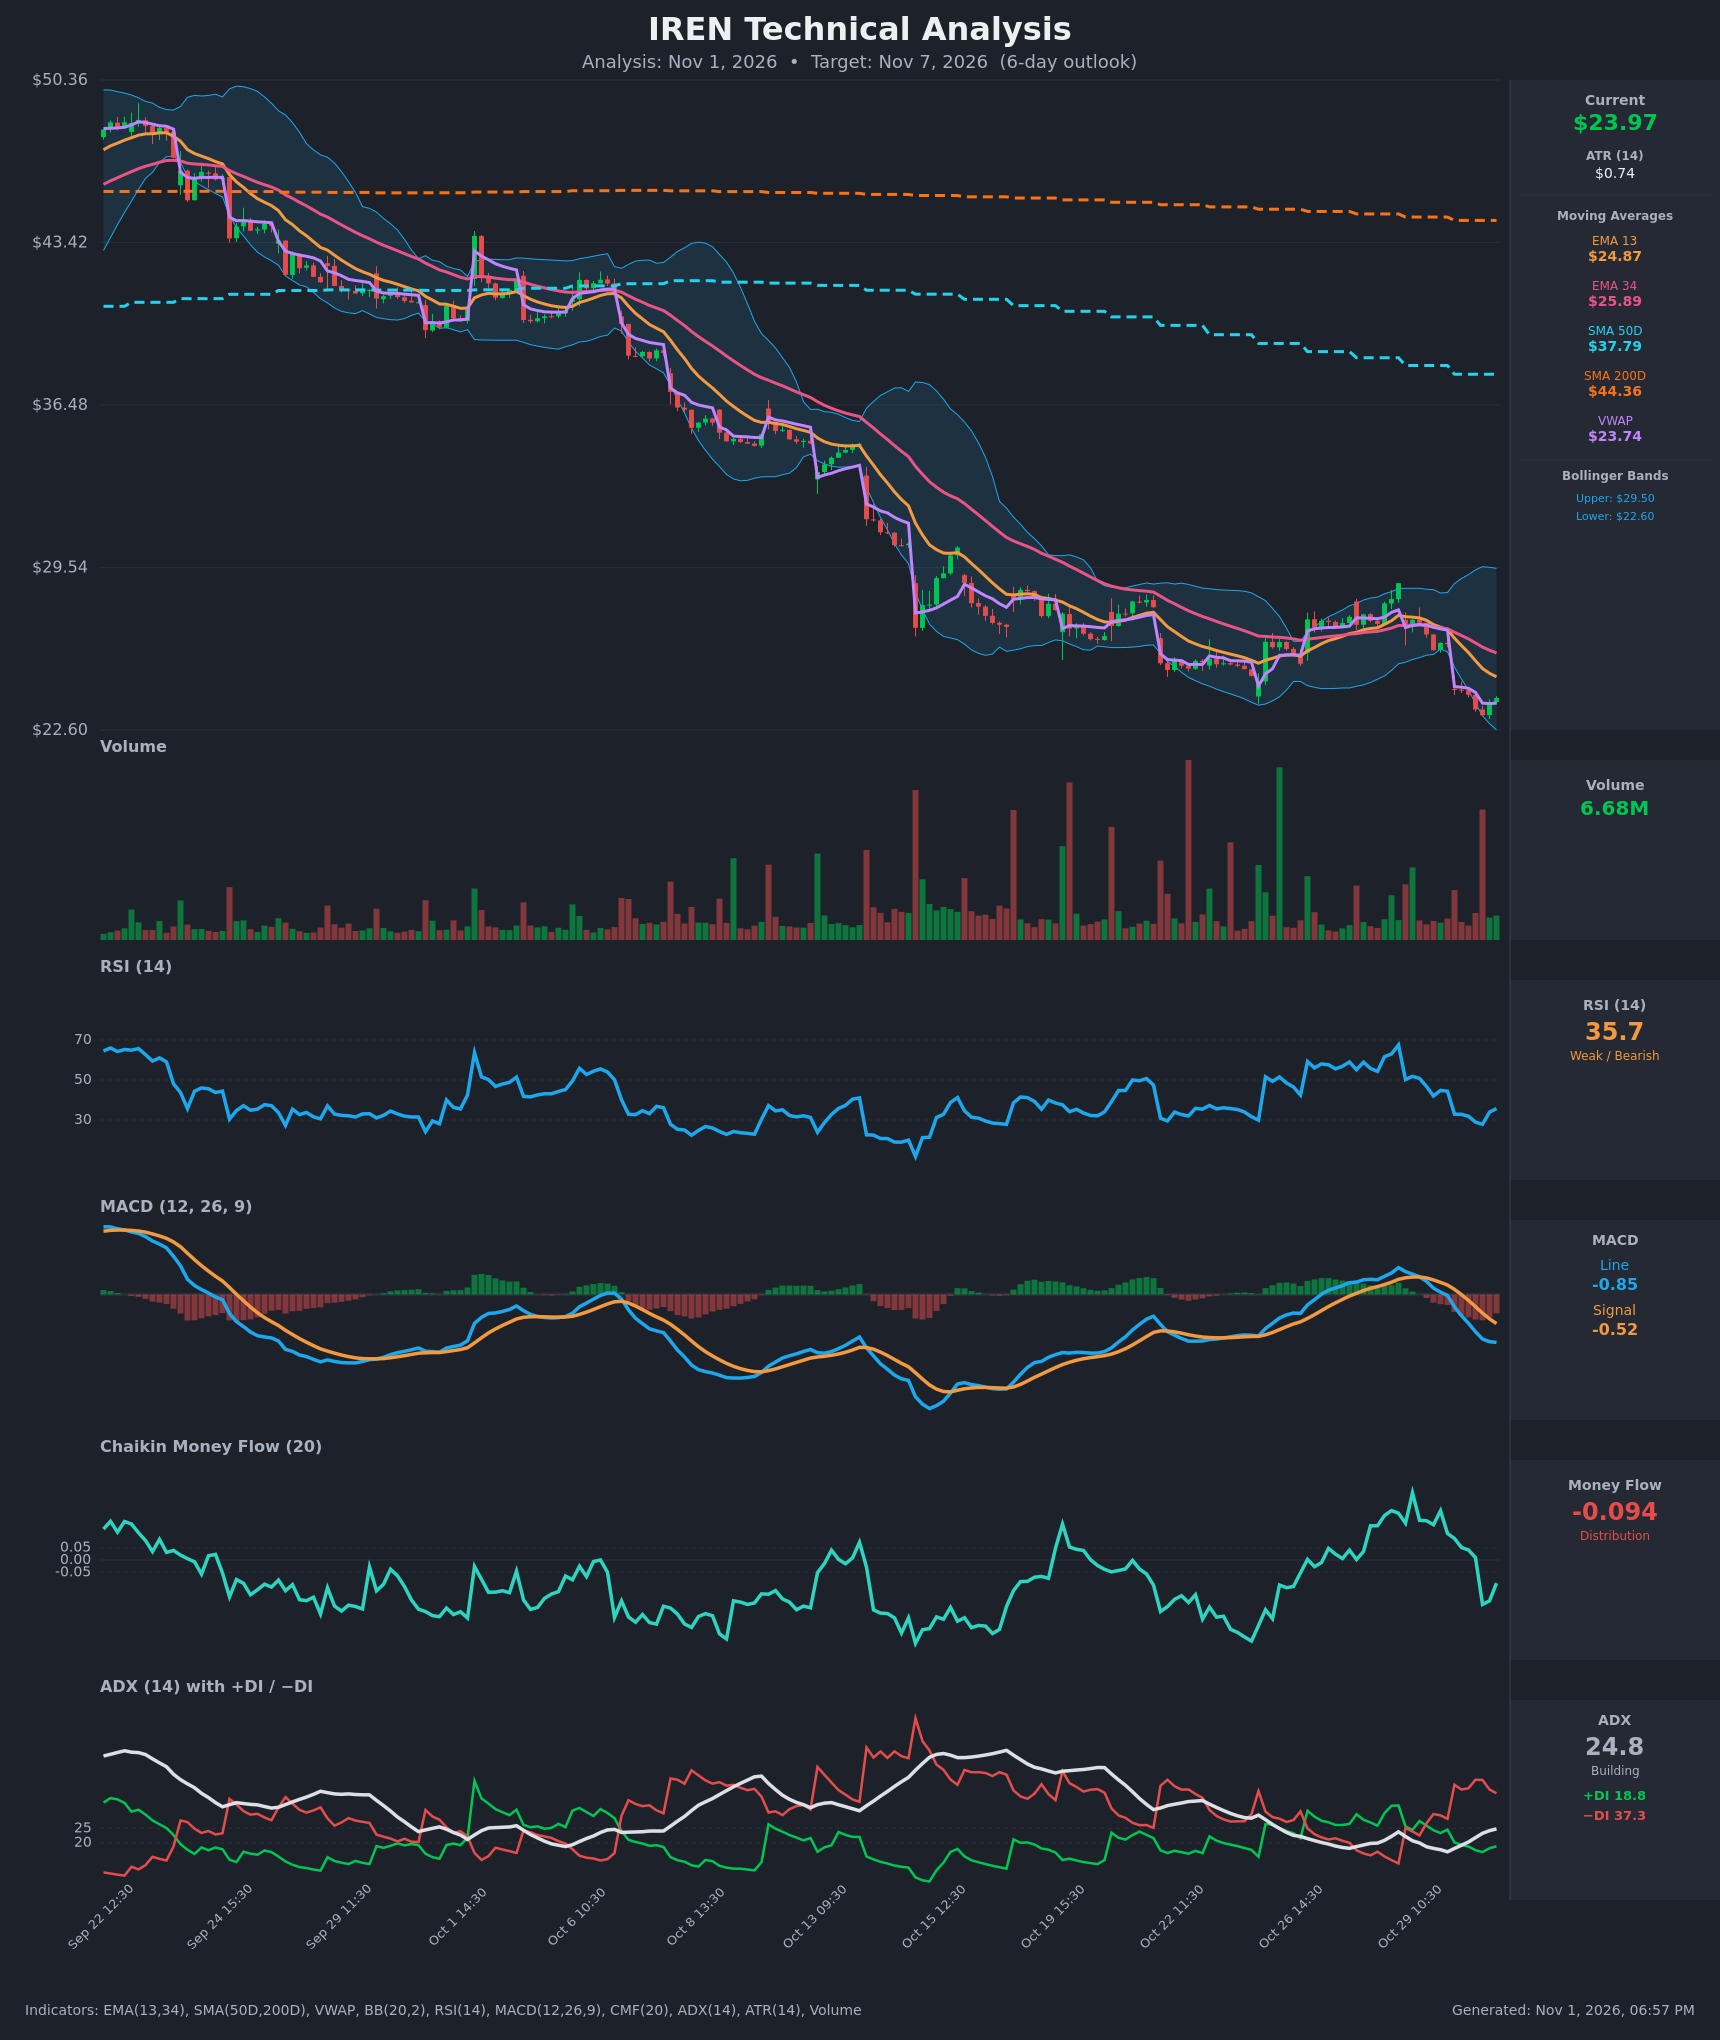
- RSI (14): 35.71, bouncing off 27.9 on Oct 30 but still below 40 and well under 50. Momentum is weak, with only a modest bounce from near-oversold. [Bearish]
- 20 EMA: The chart shows EMA 13 at $24.87 and EMA 34 at $25.89, both above price at $23.97. EMA13 is below EMA34, a bearish alignment, and both are sloping down. They act as overhead resistance. [Bearish]
- MACD: Line -0.854 is below signal -0.518 after a bearish cross on Oct 30 (09:30 to 10:30). The histogram is negative and widening (about -0.34), so downside momentum is still expanding. [Bearish]
- Bollinger Bands (20): Upper $29.50, lower $22.60. Price at $23.97 sits in the lower quarter of the bands, just above the lower band after tagging it. The bands are somewhat wide, and a walk along the lower band is typical in downtrends. A bounce toward the midline (~$26) is possible, but the trend is still down. [Bearish]
- CMF (20): -0.094, below the -0.05 threshold, so distribution. It has ticked up from -0.179 but remains negative. [Distribution]
- ADX (14): 24.8 and rising, close to the 25 trend threshold. −DI (37.3) is far above +DI (18.8), so bears are firmly in control. [Strong Trend – Bearish]
- Volume: 6.68M on the latest bar, moderate. Large red volume spikes on selloffs (including the recent Oct 30 gap down) show heavier selling than buying. The latest bounce is on light volume. [Bearish – selling pressure dominates]
DIVERGENCES & TRENDS
- No clear bullish RSI divergence. RSI made a higher low (27.9 vs. 28.9 / earlier ~24 on Oct 15) only loosely, and price made new lows, so it is not a reliable signal.
- Price is far below the SMA50D ($37.79) and SMA200D ($44.36). The SMA50D is under the SMA200D, which is a death-cross structure and a long-term downtrend.
- EMA13 < EMA34 < SMA50D < SMA200D is a fully bearish stack. Price is below VWAP ($23.74)? No, it is slightly above ($23.97 vs. $23.74), a minor short-term support sign.
- MACD crossed bearishly on Oct 30 and is accelerating downward. The −DI/+DI gap is wide, and ADX is turning up, confirming trend strength.
- A small bounce off the lows (23.23 to 23.97) with RSI and CMF ticking up suggests a relief rally attempt, but it is capped by the EMAs near $24.87 to $25.89.
CHART PATTERNS
- The broader structure is a persistent downtrend with lower highs and lower lows from ~$48 to ~$23. Over the last two weeks, price formed a sideways base around $24.5 to $29, and has now broken below it. This resembles a Bearish Rectangle / Descending channel continuation, with a breakdown from a consolidation near $25.
- The range of about $4 to $5 (roughly $24.5 to $29) projects a measured move toward $20 to $21 if the breakdown continues, though only partial follow-through is likely within 6 days.
- There is no reliable reversal pattern (no double bottom or inverse H&S) yet.
POTENTIAL SCENARIOS
- Scenario 1: Bearish Trend Continuation — Price fails at the EMA13 (~$24.87) and the broken support area, then resumes the downtrend with −DI dominance and a widening MACD histogram. Trigger: Break below the $23.23 recent low and the lower Bollinger Band (~$22.60). Target: $21.50 to $22.50. Invalidation: Daily close above $25.90 (EMA34). (55% probability)
- Scenario 2: Neutral/Bullish Relief Bounce — Oversold conditions with RSI in the 30s and price hugging the lower band spark a dead-cat bounce toward the EMA13/EMA34 zone. Trigger: Reclaim of $24.87 on rising volume. Target: $25.90 to $26.50. Invalidation: Drop back below VWAP ($23.74) and $23.23. (35% probability)
- Scenario 3: Neutral Chop — Price oscillates between $22.60 and $25.00 as ADX hovers near 25. Trigger: No decisive break of either side. Target: $23.50 to $24.50. Invalidation: Move beyond either extreme. (10% probability)
PRICE TARGETS
For the 6-day timeframe (range width should be ~5-8% of current price, but with the elevated ATR of $0.74 (~3% per day), I use ~9% to reflect realized volatility):
- Target Price: $23.10 (6 days)
- Expected Range: $21.60 to $25.30 (width $3.70, about 15.4% of price). Check: this exceeds the 4-8% guide, but is justified by ATR of ~3% per day and ~7.5% daily-range expansion over 6 days; it remains much wider than a 2-3 day range.
- Key Levels: Support at $22.60 (lower Bollinger Band), Resistance at $24.87 (EMA 13)
OVERALL BIAS
OVERALL BIAS: BEARISH - Price is below a fully bearish moving-average stack, MACD has crossed down with a widening histogram, −DI dominates +DI with ADX rising, and CMF shows distribution. Oversold RSI could allow a bounce, but rallies toward $24.87 to $25.90 are likely to meet resistance.
This is educational analysis and not financial advice.