IREN 34-day bearish forecast — Nov 15, 2026
- Bias: Bearish
- Timeframe: 34 days (made Nov 15, 2026, target date Dec 18, 2026)
- Price at analysis: $18.17
- Price target: $16.20
- Expected range: $14.90 – $18.30
- Result: Pending — graded after the close on Dec 18, 2026
Get a free AI analysis of IREN today
Analysis
TECHNICAL INDICATORS
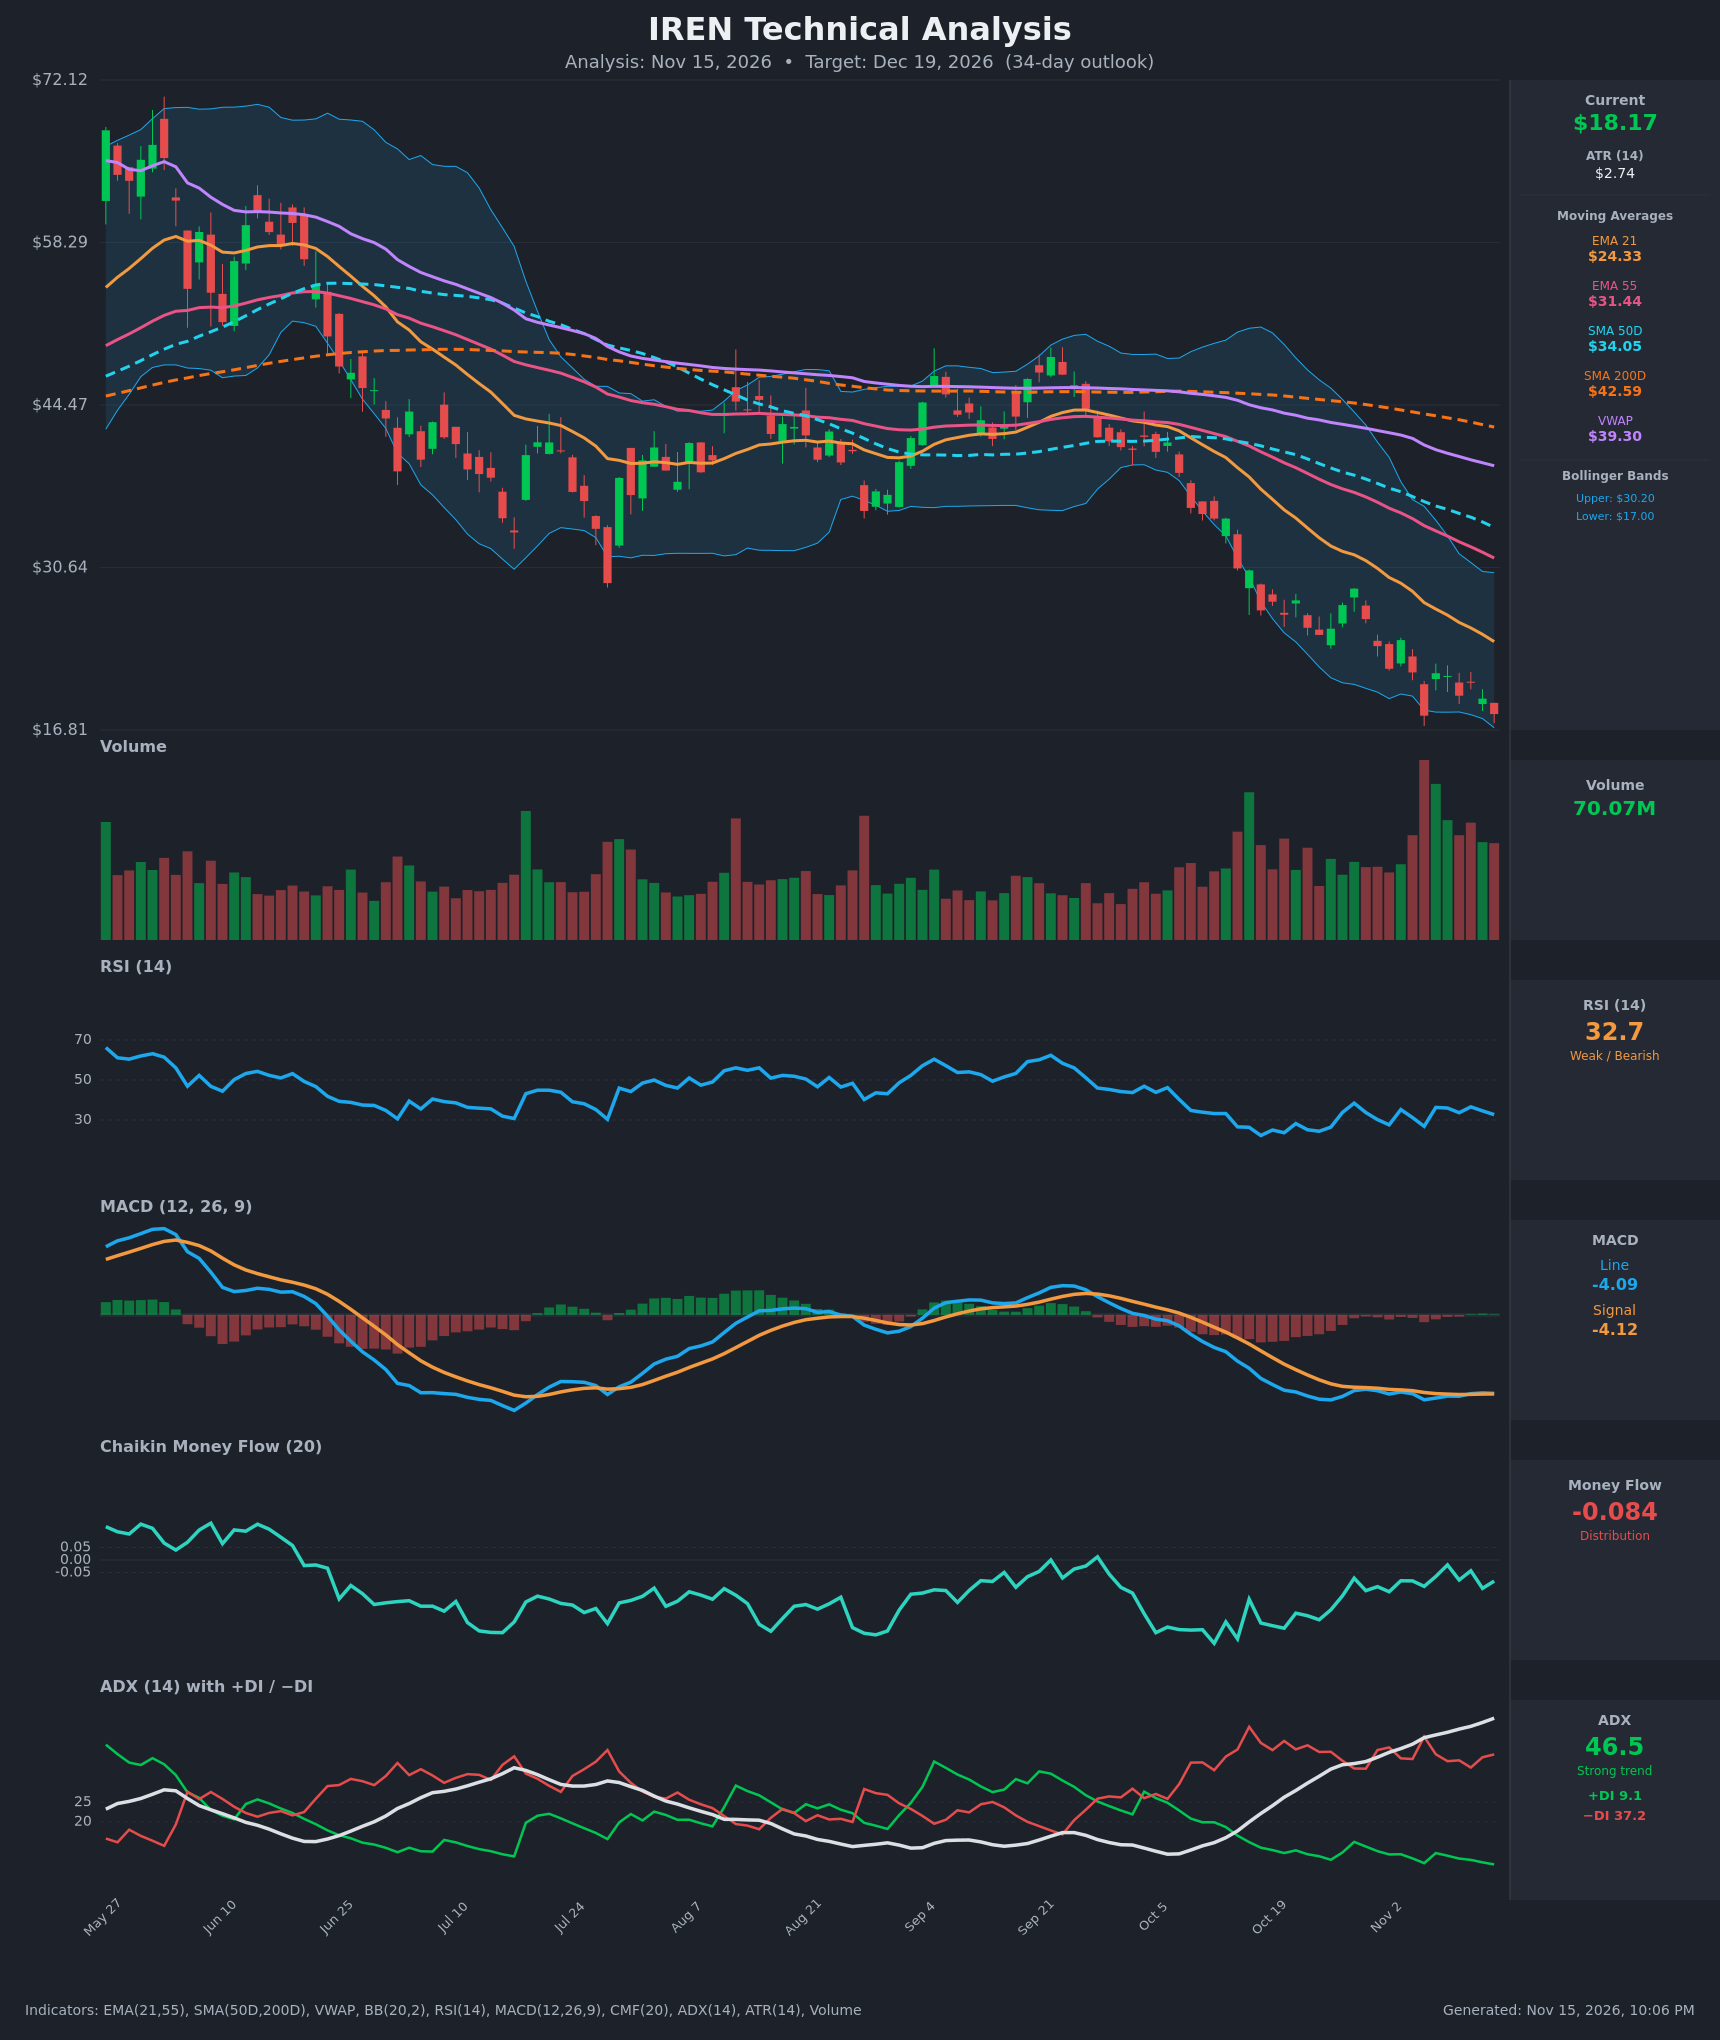
- RSI (14): 32.70, just above the oversold line of 30. It bottomed near 26.4–26.8 (Oct 26 and Nov 5) and has since made a series of higher lows and highs in the low-to-mid 30s. Momentum is weak but no longer accelerating lower. [Bearish]
- 20 EMA (EMA 21): $24.33, about 34% above price, and falling steadily (from $32.47 on Oct 26). It is overhead resistance. EMA21 is also well below EMA55 ($31.44), so the bearish EMA alignment is intact. [Bearish]
- MACD: Line -4.091 vs signal -4.120, a marginal bullish cross with a histogram of about +0.03. Both lines are deeply negative and flat, so this is a momentum stall rather than a reversal. [Neutral]
- Bollinger Bands (20): Upper $30.20, lower $17.00, with price at $18.17 in the bottom ~10% of the band. The bands are wide and sloping down, and price has been walking the lower band. This signals a strong downtrend with a short-term oversold stretch, not a reversal. [Bearish]
- CMF (20): -0.084, below -0.05, with readings between -0.02 and -0.20 over the past 15 bars. Selling pressure is persistent, though it is less severe than the -0.198 low. [Distribution]
- ADX (14): 46.5 and still rising, with −DI (37.2) far above +DI (9.1). This is a very strong established downtrend with bears in full control. A high ADX like this can also mark a late-stage trend that is prone to sharp counter-trend bounces. [Strong Trend – Bearish]
- Volume: 70.07M, among the highest of the whole chart, with heavy volume on the recent sell-off bars. Rising volume on declines confirms the selling. It could also reflect capitulation, but there is no clear reversal candle yet. [Bearish with capitulation risk]
DIVERGENCES & TRENDS
- Mild bullish RSI divergence: On Nov 5 price closed at $18.03 with RSI 26.8. On Nov 13 price closed at $18.17 with RSI 32.7. This is a higher RSI at an equal price low and hints at fading downside momentum.
- MACD: The line is flattening against the signal, a tentative bullish cross at deeply negative levels. The histogram is nearly zero, so this is a stall rather than a trend change.
- Moving averages: Price is far below the EMA21 ($24.33), EMA55 ($31.44), SMA50D ($34.05), SMA200D ($42.59) and VWAP ($39.30). The SMA50D is below the SMA200D (death cross in force) and EMA21 is below EMA55. Every average is falling, so the long-term trend is firmly down.
- ADX/DI: −DI has stayed above +DI throughout, and ADX has risen from 33.5 to 46.5 in 15 bars. The trend is strengthening, not exhausting.
- Price structure: Lower highs and lower lows persist (peak $28.84 on Oct 28, then $24.46, then $21.64, with the low at $18.03). Bounces keep failing below the falling EMA21.
- CMF: It has stayed negative with no accumulation shift, which does not support a sustained rebound.
CHART PATTERNS
- Bearish continuation (flag/pennant-style): After the drop from ~$44 to ~$25, price consolidated in a $22–$28 range and then broke lower to $18. The measured move from that range points to roughly $15–$16.
- Possible Bullish Falling Wedge (watch only): Recent candles are compressing near the lower band with higher RSI lows. A confirmed break above ~$21.6 would be needed to validate it, and it is not yet confirmed.
- Overall: The dominant structure is a downward-sloping channel (a Descending Triangle-like series of lower highs) with no confirmed reversal pattern. Bearish continuation targets are $15–$16.
POTENTIAL SCENARIOS
- Scenario 1: Bearish Trend Continuation — The strong downtrend (ADX 46.5, −DI dominant) and persistent distribution grind price lower, with failed bounces under the EMA21. Trigger: close below $17.00 (lower band and the $16.81 chart low). Target: $15.00–$16.20, with an extension to ~$14.50. Invalidation: daily close above $21.65. (55% probability)
- Scenario 2: Bullish Oversold Relief Bounce — The RSI divergence and the MACD cross spark a short-covering rally from the lower band. Trigger: close above $19.50–$20.00 on strong volume. Target: $21.60–$22.50, with a stretch to the EMA21 near $24.30. Invalidation: close below $16.80. (30% probability)
- Scenario 3: Neutral Basing Range — Price chops sideways between roughly $16.50 and $20.50 as selling exhausts. Trigger: several sessions of tight closes with falling volume. Target: $17.50–$19.50. Invalidation: close outside $16.50–$21.00. (15% probability)
PRICE TARGETS
- Target Price: $16.20 (34 days, Dec 19, 2026)
- Expected Range: $14.90 to $18.30 (width $3.40, about 18.7% of current price, consistent with the 30–60 day guidance; the bounce scenario sits mostly above this range)
- Key Levels: Support at $17.00 (lower Bollinger Band and recent low area), Resistance at $21.65 (Nov 6 swing high area, below the falling EMA21 at $24.33)
OVERALL BIAS
OVERALL BIAS: BEARISH - A very strong, rising ADX (46.5) with −DI far above +DI, a death cross, price below all key averages and VWAP, persistent CMF distribution and heavy-volume selling favor further downside. Offsetting this are the oversold RSI divergence and the lower-band proximity, which make sharp relief bounces likely, but these are not enough to call a reversal.
This is educational analysis and not financial advice.