IREN 62-day bearish forecast — Nov 15, 2026
- Bias: Bearish
- Timeframe: 62 days (made Nov 15, 2026, target date Jan 15, 2027)
- Price at analysis: $18.17
- Price target: $16.00
- Expected range: $13.80 – $19.30
- Result: Pending — graded after the close on Jan 15, 2027
Get a free AI analysis of IREN today
Analysis
TECHNICAL INDICATORS
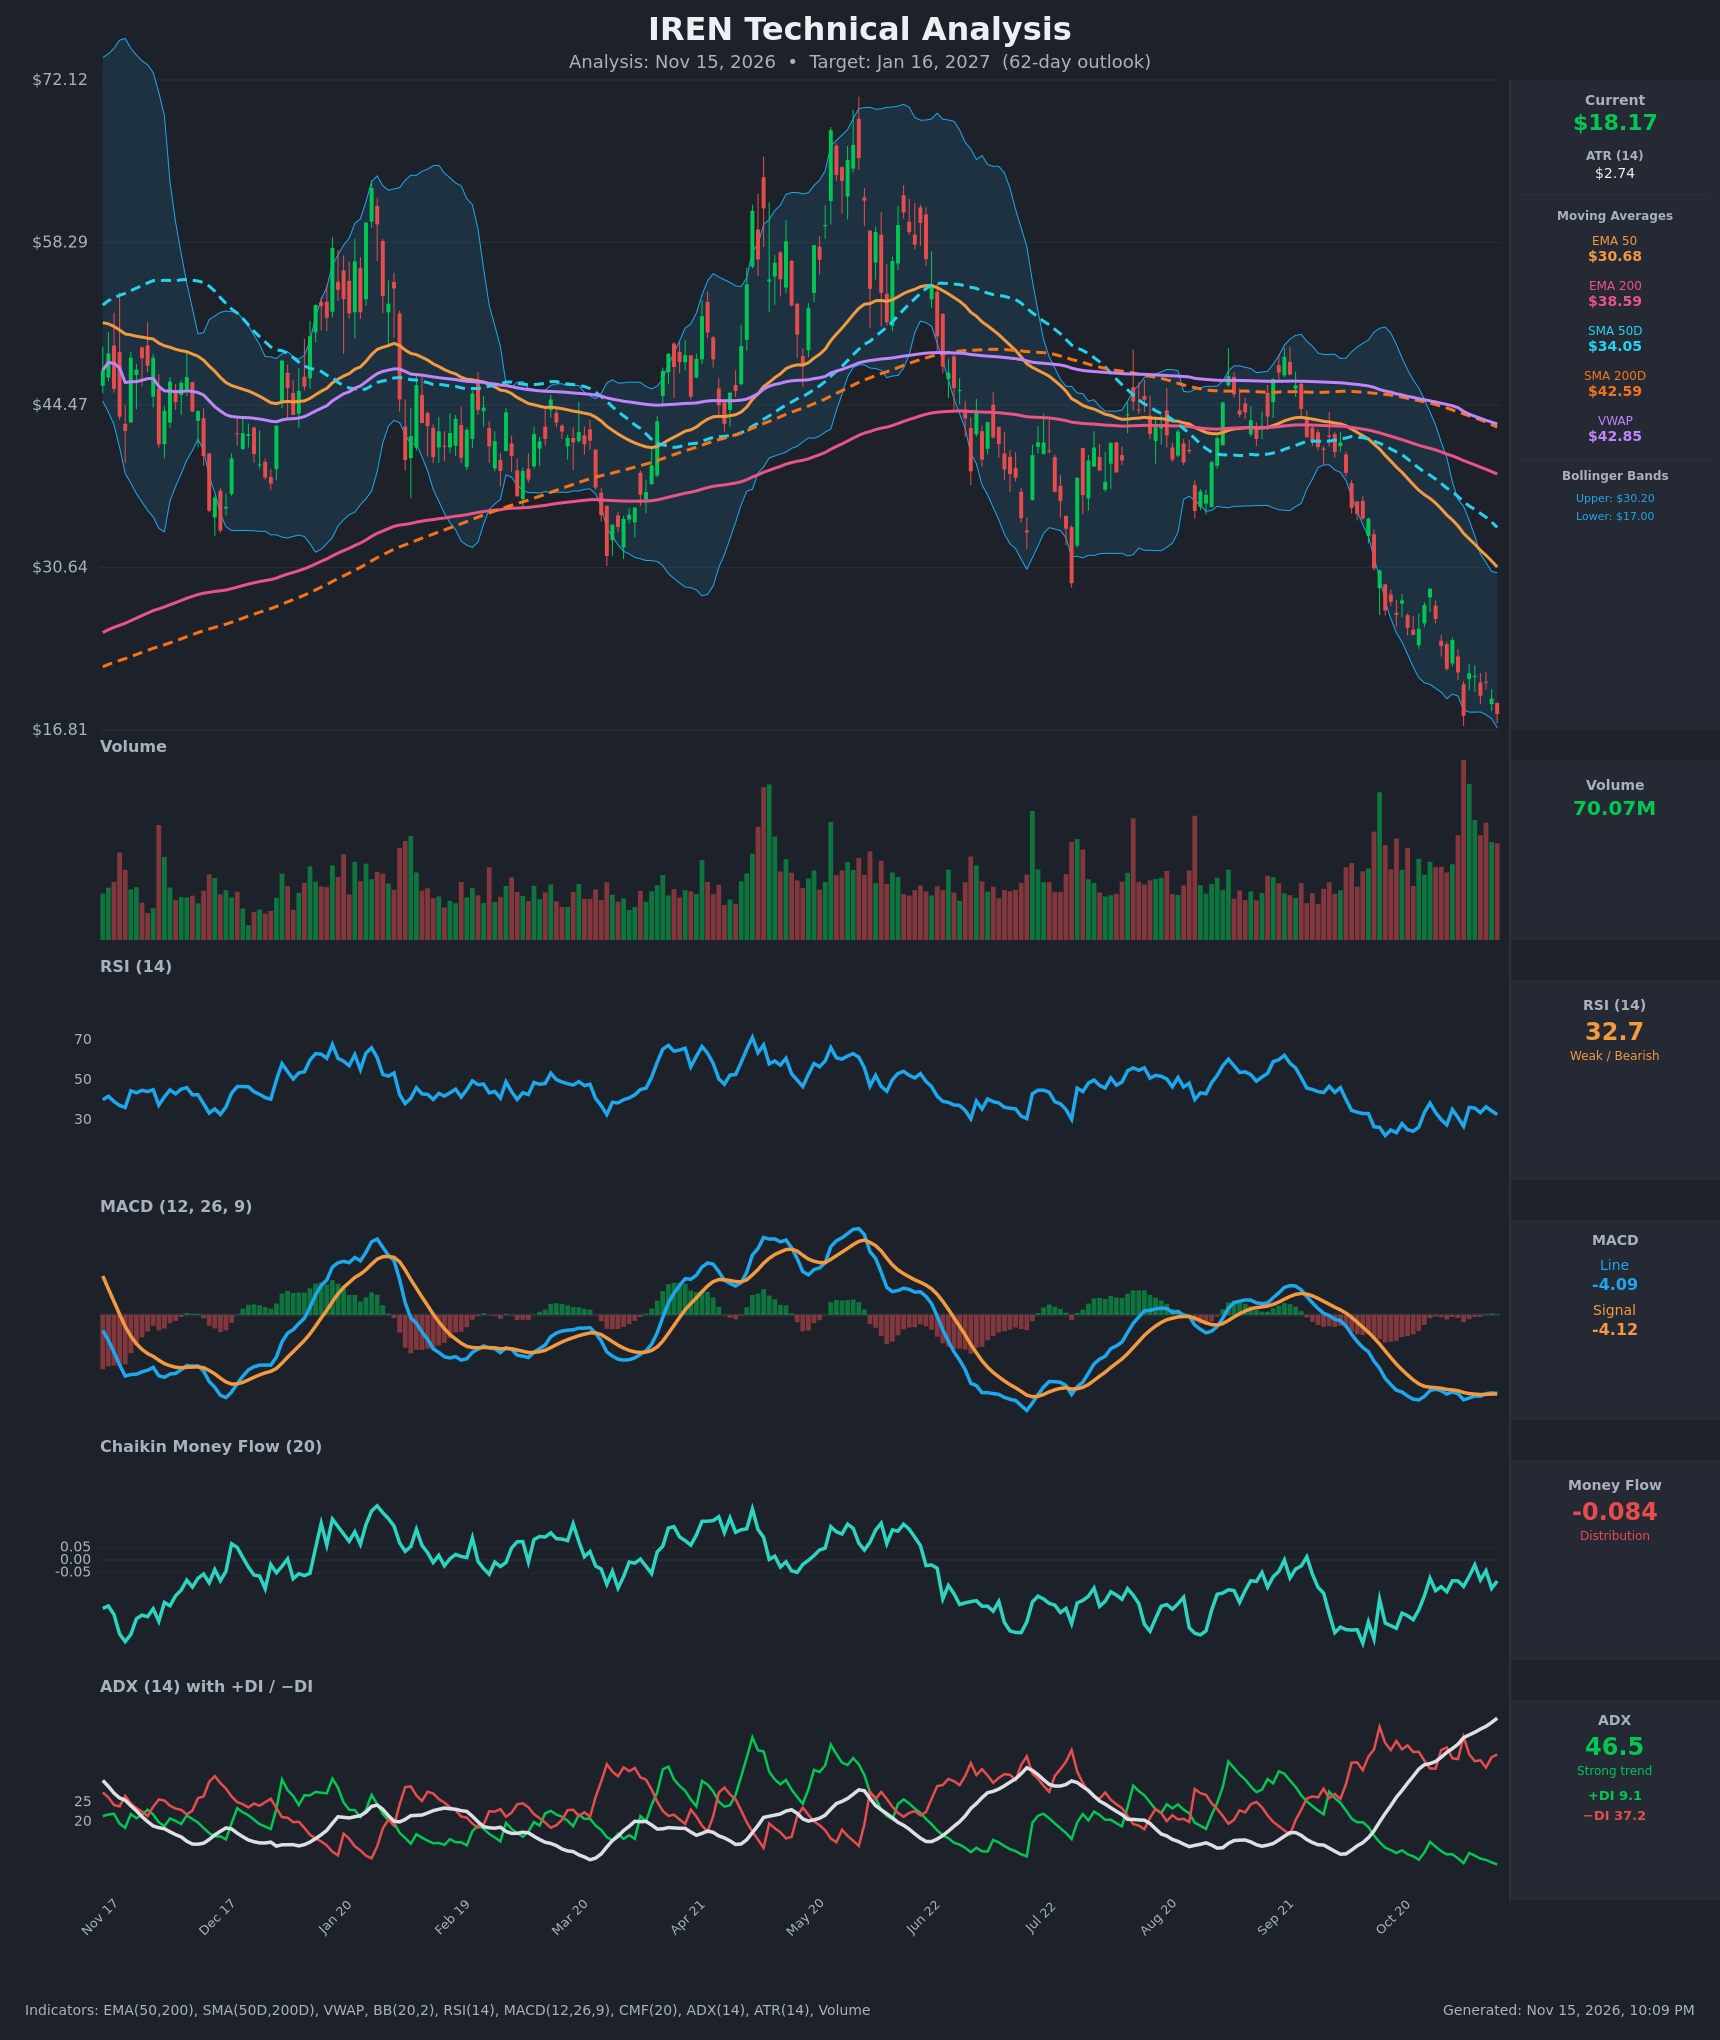
- RSI (14): 32.70, close to oversold but not there. It reached 26-27 on Oct 26 and Nov 5, then bounced to the mid-30s each time and failed. Momentum is weak with no sign of a turn. [Bearish]
- 20 EMA: The 20 EMA is not provided. Price ($18.17) sits far below the EMA 50 ($30.68) and EMA 200 ($38.59), which act as heavy overhead resistance. The EMA 50 is falling steeply and is 40% above price. [Bearish]
- MACD: Line -4.091 vs signal -4.120, giving a histogram of about +0.03. This is a marginal, flat crossover deep below zero, with no real bullish momentum. The line has been stuck near -4 for two weeks while price kept falling, so it signals little more than momentum stalling. [Neutral]
- Bollinger Bands (20): Upper $30.20, lower $17.00. Price is at the lower band and has been hugging or walking it since late October. That marks an extended trend rather than a reversal, and the bands are wide, reflecting high volatility. A short-term bounce is possible, but a walk down the band is the more common outcome in a strong trend. [Bearish]
- CMF (20): -0.084, in distribution territory (below -0.05). It has been negative for most of the decline, with readings between -0.02 and -0.20 over the last 15 bars. The chart shows a slight improvement from the lows, but selling pressure still dominates. [Distribution]
- ADX (14): 46.5 and rising steadily from about 33 on Oct 26. −DI is 37.2 and +DI is only 9.1, so the bears are firmly in control. This is a very strong, mature downtrend. A reading above 45 can signal exhaustion, but it has not turned down yet. [Strong Trend – Bearish]
- Volume: 70.07M, among the highest of the year. Volume surged during the breakdown from late October. Heavy volume near the lows could mean capitulation, but with no reversal candle or volume-confirmed base yet, it reads as continued liquidation. [Bearish / Possible Capitulation]
DIVERGENCES & TRENDS
- No bullish RSI divergence yet. RSI's Nov 5 low (26.8) was only slightly below its Oct 26 low (26.4) while price made a clearly lower low ($18.03 vs $25.43). Momentum is not declining as fast as price, but this is not a confirmed divergence.
- Moving averages are fully bearish. EMA 50 is below EMA 200 and SMA 50D is below SMA 200D, so both death crosses are in place. Price is below every average, VWAP ($42.85) is 135% above price, and every average is still sloping down.
- MACD has flattened near -4.1 and is no longer making new lows. This shows a loss of downside acceleration, but the line remains deeply negative.
- ADX is rising with −DI dominant and +DI near 9, so selling pressure is persistent. CMF has been negative since the June breakdown, apart from a few brief spikes.
- Price is making lower highs ($28.84 → $24.46 → $21.64 → $20.84) and lower lows ($25.43 → $22.02 → $18.03).
CHART PATTERNS
- Primary: sustained downtrend with a possible Bearish Flag/Pennant. The sharp drop from about $44 to $18 is followed by a small, choppy consolidation between roughly $18 and $24. A measured-move breakdown below $18 would point to the mid-teens or lower.
- Alternative: Bullish Falling Wedge / Bullish Expanding Triangle. The sequence of lower highs and lows near the lower Bollinger Band could be read as a falling wedge, but it is unconfirmed. It needs a close above about $22 on volume to validate, and a bounce toward $22-$24 would be consistent with it.
- Broader context: the 2026 range ($30-$70) has broken down. The $30 area, the previous support, is now resistance.
POTENTIAL SCENARIOS
- Scenario 1: Bearish Trend Continuation — The strong downtrend (ADX 46.5, −DI 37) continues, with price pressing the lower band and making new lows. Rallies fade at declining averages. Trigger: daily close below $17.00 and then $16.81 (the chart low). Target: $15.00-$16.00, with an extension to about $14. Invalidation: daily close above $22 on strong volume. (50% probability)
- Scenario 2: Bullish Oversold Relief Bounce — Capitulation-style volume and RSI near 30 spark a mean-reversion rally toward the 20-day area and prior lower highs, but the downtrend is not reversed. Trigger: close above $21.64 (Nov 6 high area) with RSI above 40. Target: $22-$24, a stretch toward $26. Invalidation: loss of $17. (35% probability)
- Scenario 3: Neutral Basing Range — Price chops between roughly $16.80 and $22 as selling exhausts, with ADX eventually rolling over. Trigger: repeated holds above $17 with declining volume. Target: $17-$21. Invalidation: a break outside the range with volume. (15% probability)
PRICE TARGETS
- Target Price: $16.00 (62 days, around Jan 16, 2027)
- Expected Range: $13.80 to $19.30. Width is $5.50, about 30% of the $18.17 current price, matching the 61-180 day guidance.
- Key Levels: Support at $16.81 (chart low and lower-band zone), Resistance at $21.64 (recent swing high)
OVERALL BIAS
OVERALL BIAS: BEARISH - The downtrend is very strong (ADX 46.5, −DI 37.2 vs +DI 9.1), with price below all moving averages, both death crosses in place, and CMF showing distribution. Price is oversold near the lower Bollinger Band and relief bounces are likely, but the structure still favors lower prices over 62 days.
This is educational analysis and not financial advice.