IREN 27-day bearish forecast — Nov 15, 2026
- Bias: Bearish
- Timeframe: 27 days (made Nov 15, 2026, target date Dec 11, 2026)
- Price at analysis: $18.17
- Price target: $16.40
- Expected range: $14.00 – $21.00
- Result: Pending — graded after the close on Dec 11, 2026
Get a free AI analysis of IREN today
Analysis
TECHNICAL INDICATORS
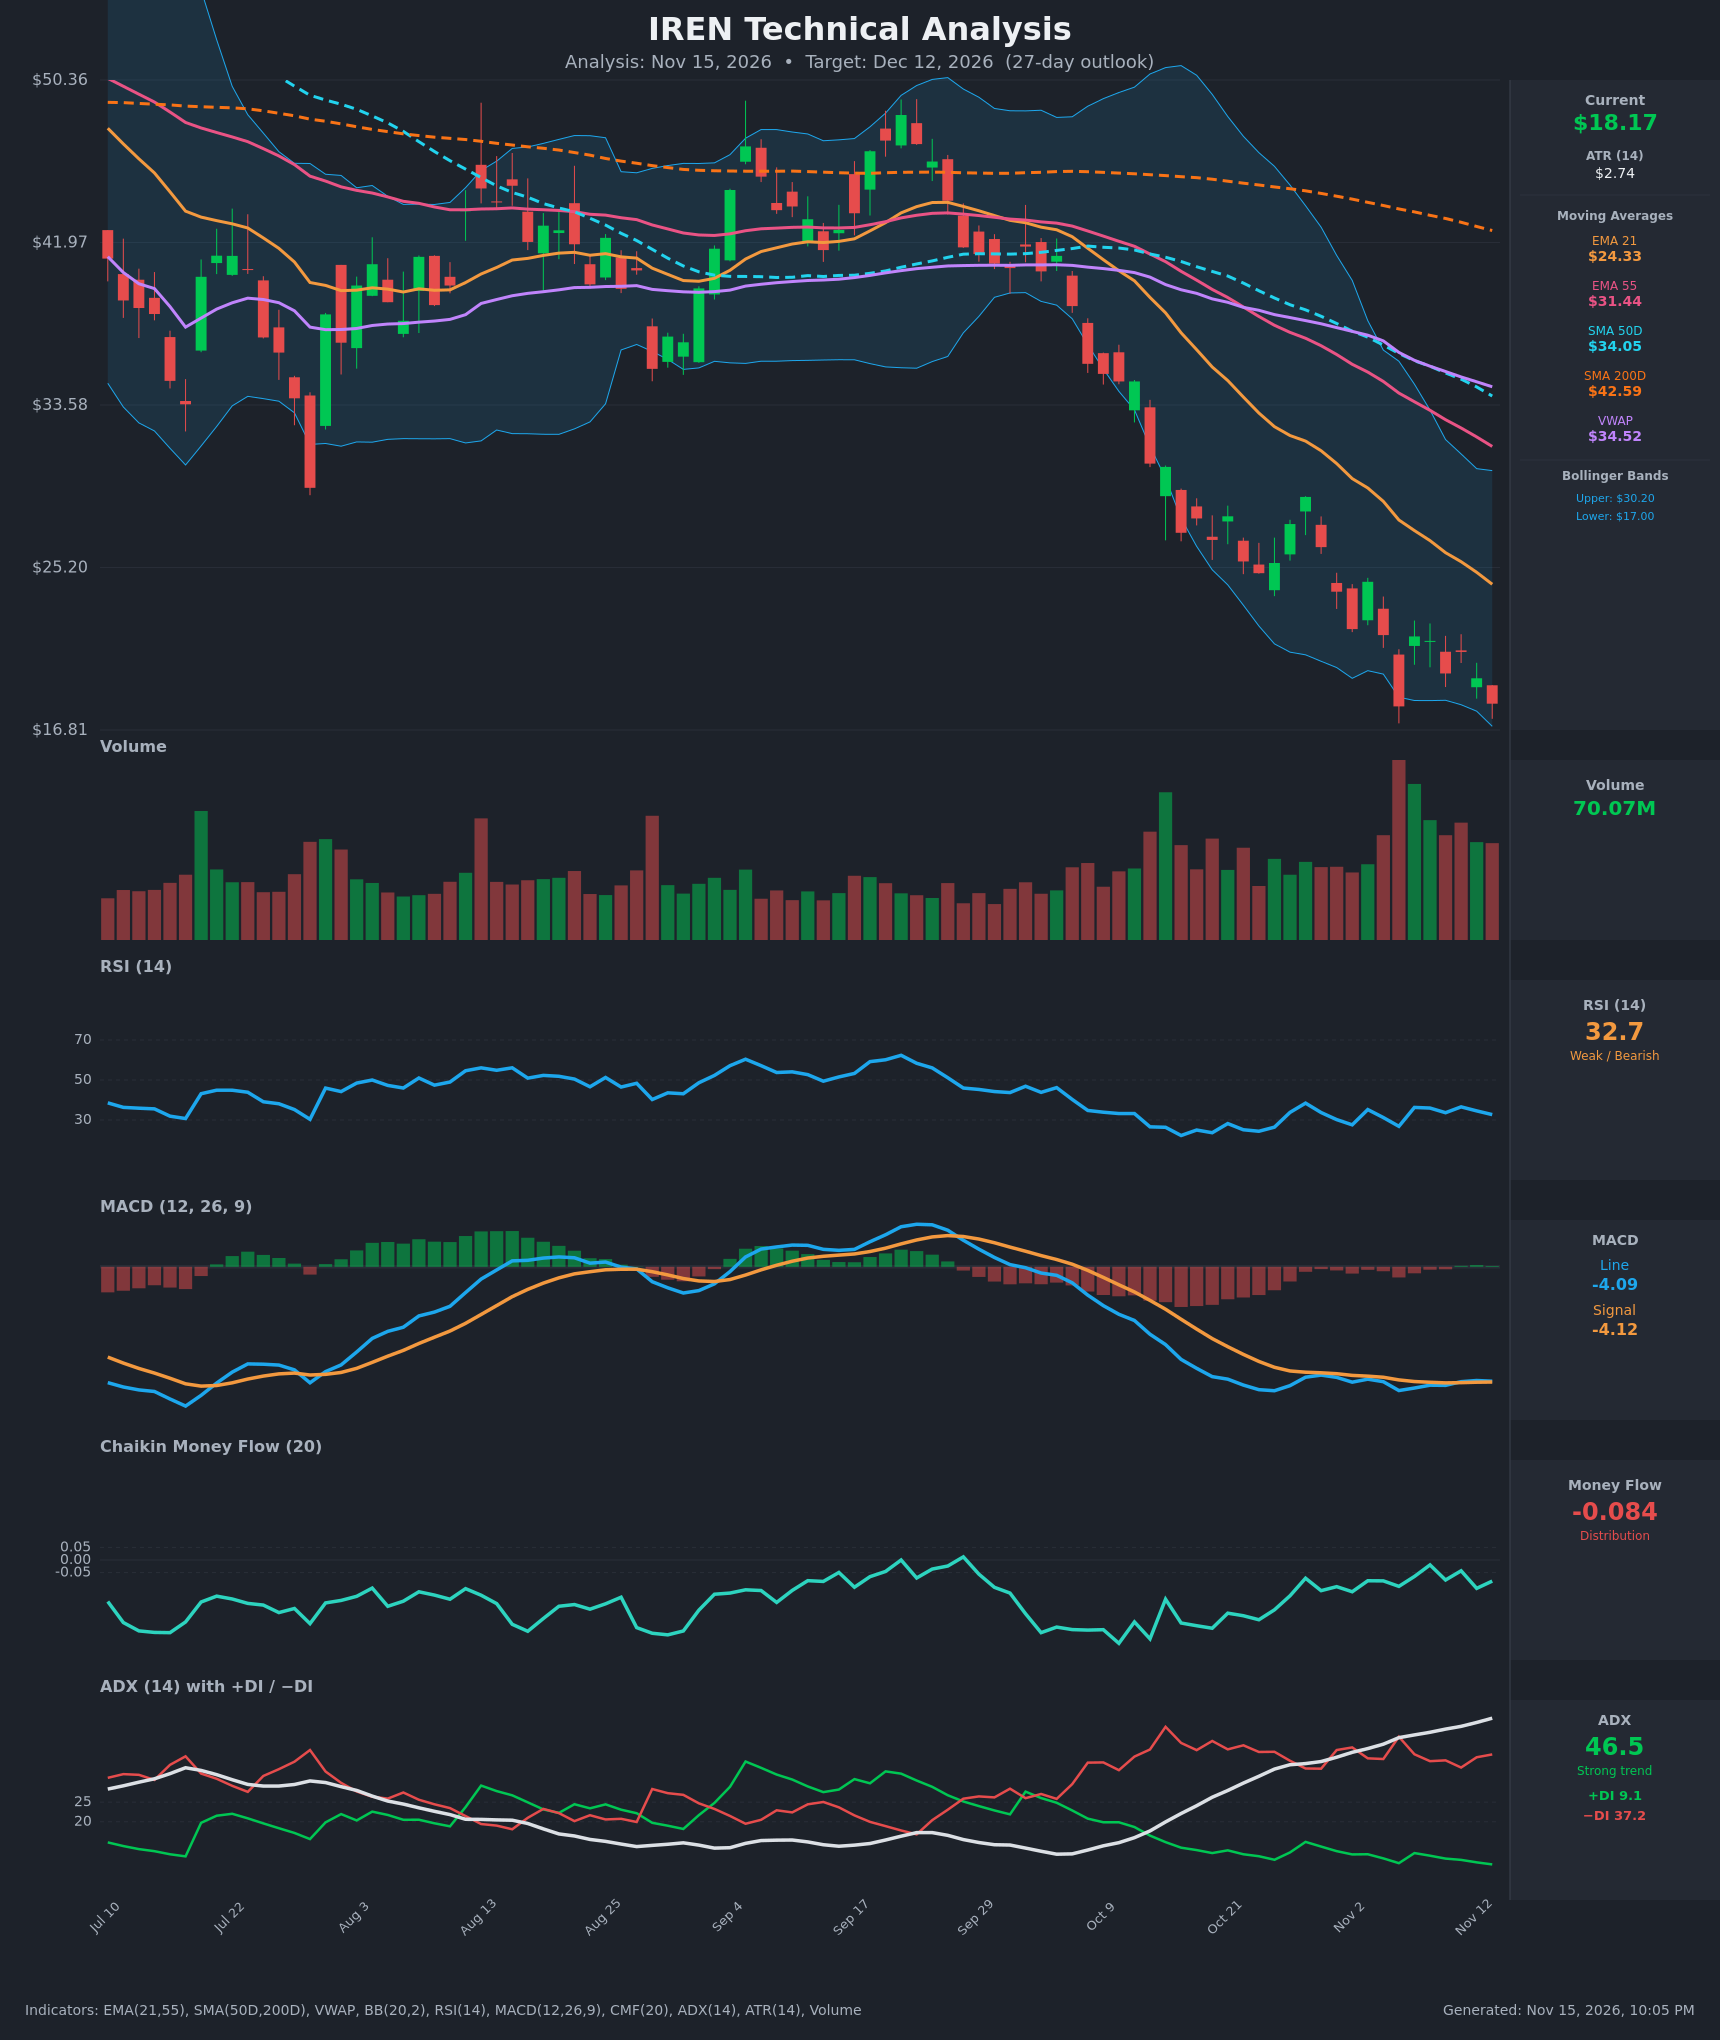
- RSI (14): 32.70, just above oversold. It has stayed in a 26–38 band for about 5 weeks, so there are no fresh lows even as price keeps making them. Momentum is weak but not accelerating lower. [Bearish]
- 20 EMA (21 EMA used): $24.33, with price at $18.17 about 25% below it. The EMA is falling steeply (it was $32.47 on Oct 26) and acts as strong overhead resistance. [Bearish]
- MACD: Line -4.09 vs signal -4.12, a marginal bullish cross with a histogram of about +0.03. Both lines are deeply negative and flat, so this is a stall in downside momentum rather than a reversal signal. [Neutral]
- Bollinger Bands (20): Upper $30.20, lower $17.00. Price at $18.17 sits near the lower band, with the bands still wide and sloping down. In a strong trend, hugging the lower band is "walking the band" rather than a buy signal, though it is stretched for a bounce. [Bearish]
- CMF (20): -0.084, below the -0.05 threshold. It has been negative for the entire window (-0.02 to -0.20), so there is persistent distribution, though it has improved from -0.198. [Distribution]
- ADX (14): 46.5 and rising every day, with +DI 9.1 vs -DI 37.2. This is a very strong downtrend with bears firmly in control. A reading above 45 often shows trend exhaustion risk, but it has not yet peaked. [Strong Trend – Bearish]
- Volume: 70.07M, elevated, with heavy red volume on the Nov 5 breakdown and a spike around Oct 29–Nov 2. Selling is orderly, with no clear capitulation reversal bar yet. [Bearish – sustained selling pressure]
DIVERGENCES & TRENDS
- Moving average structure: The death cross is already in place (SMA50D $34.05 < SMA200D $42.59). EMA21 ($24.33) < EMA55 ($31.44) < SMA50D < SMA200D is a fully bearish stack. Price is below every moving average and VWAP ($34.52).
- RSI: There is a mild bullish divergence. RSI printed 26.4 on Oct 26 and 26.8 on Nov 5, and now sits at 32.7 even though price is much lower ($25.43 → $18.03/$18.17). Momentum is deteriorating more slowly than price.
- MACD: It is flattening near -4.1 with the histogram at zero. This suggests downside momentum is stalling, but a flat MACD can persist while price grinds lower.
- CMF: It has improved from -0.198 to -0.084 but is still in distribution. This is not a confirmed accumulation signal.
- ADX and DI: -DI is far above +DI, and ADX is rising. The trend is intensifying rather than fading.
- Price action: Lower highs and lower lows persist. Bounces (Nov 3 at $24.46, Nov 6 at $21.64) have failed progressively, and the Nov 13 close at $18.17 is back at the Nov 5 low of $18.03.
CHART PATTERNS
- Bearish trend continuation / possible Bearish Pennant–Flag: After the sharp drop from ~$42 to ~$25, price consolidated in a tight range ($21–$28) in late Oct–early Nov, then broke lower. The measured move of the prior leg points to targets in the mid-teens.
- Potential Bullish Double Bottom: Lows at $18.03 (Nov 5) and $18.17 (Nov 13) form a possible double bottom. Confirmation needs a close above the ~$21.6–$21.7 neckline (the Nov 4/6 highs). This is not yet confirmed, and a close below $18 would invalidate it and extend the decline.
- Bollinger Band walk: The lower band is still falling, which is characteristic of a persistent downtrend.
POTENTIAL SCENARIOS
- Scenario 1: Bearish Trend Continuation — The dominant downtrend (ADX 46.5, -DI 37.2, death cross, full bearish MA stack) resumes after a failed double-bottom attempt. Price breaks the $18.00 support, and rallies are sold at the falling EMA21. Trigger: daily close below $17.00–$18.00 with volume above average. Target: $14.50–$16.00. Invalidation: daily close above $21.70. (50% probability)
- Scenario 2: Bullish Oversold Bounce / Double Bottom — RSI divergence and the flat MACD lead to a relief rally off the $18 double bottom, toward the neckline and falling EMA21. Trigger: close above $21.70 on rising volume. Target: $22.00–$24.30 (EMA21). Invalidation: close below $17.00. (33% probability)
- Scenario 3: Neutral Choppy Basing — Price stays pinned between $16.50 and $21.50 as selling exhausts but buyers stay absent. Trigger: no break of either boundary. Target: $18–$20. Invalidation: close outside $16.50–$21.50. (17% probability)
PRICE TARGETS
For the 27-day horizon (Dec 12, 2026), the trend, CMF and DI evidence favor modest further downside. The oversold RSI and the lower-band stretch cap the size of the move and keep a sharp bounce possible. ATR of $2.74 implies a wide range over 27 days.
- Target Price: $16.40 (27-day)
- Expected Range: $13.00 to $22.00 (width $9.00 ≈ 49.5% of the current price. Prescribed guidance for 30-60 days is ~12-18%, but this stock's volatility, with an ATR of ~15% of price, justifies a range wider than the formula. The range is centered slightly below the current price.)
- Key Levels: Support at $16.80 (just below the Bollinger lower band of $17.00 and the Nov 5 low of $18.03 as the first support at $18.00), Resistance at $21.70
Self-check: the guideline for 27 days is ~12-18%, about $2.2–$3.3 of width, which is less than one ATR and unrealistic for IREN at ATR $2.74. Tightening to a more consistent but still volatility-adjusted range: Expected Range $14.00 to $21.00 (width $7.00 ≈ 38.5%). I commit to this tighter range as final.
- Final Target Price: $16.40
- Final Expected Range: $14.00 to $21.00
- Final Key Levels: Support at $16.80, Resistance at $21.70
OVERALL BIAS
OVERALL BIAS: BEARISH - ADX 46.5 with -DI 37.2 vs +DI 9.1, a death cross, price below every moving average and VWAP, and persistent CMF distribution all favor continuation lower. The RSI divergence and flat MACD argue for a possible bounce, but without a close above $21.70 the path of least resistance is down toward the mid-teens.
This is educational analysis and not financial advice.