IREN 83-day bullish forecast — Nov 15, 2026
- Bias: Bullish
- Timeframe: 83 days (made Nov 15, 2026, target date Feb 5, 2027)
- Price at analysis: $18.17
- Price target: $19.40
- Expected range: $15.80 – $21.20
- Result: Pending — graded after the close on Feb 5, 2027
Get a free AI analysis of IREN today
Analysis
TECHNICAL INDICATORS
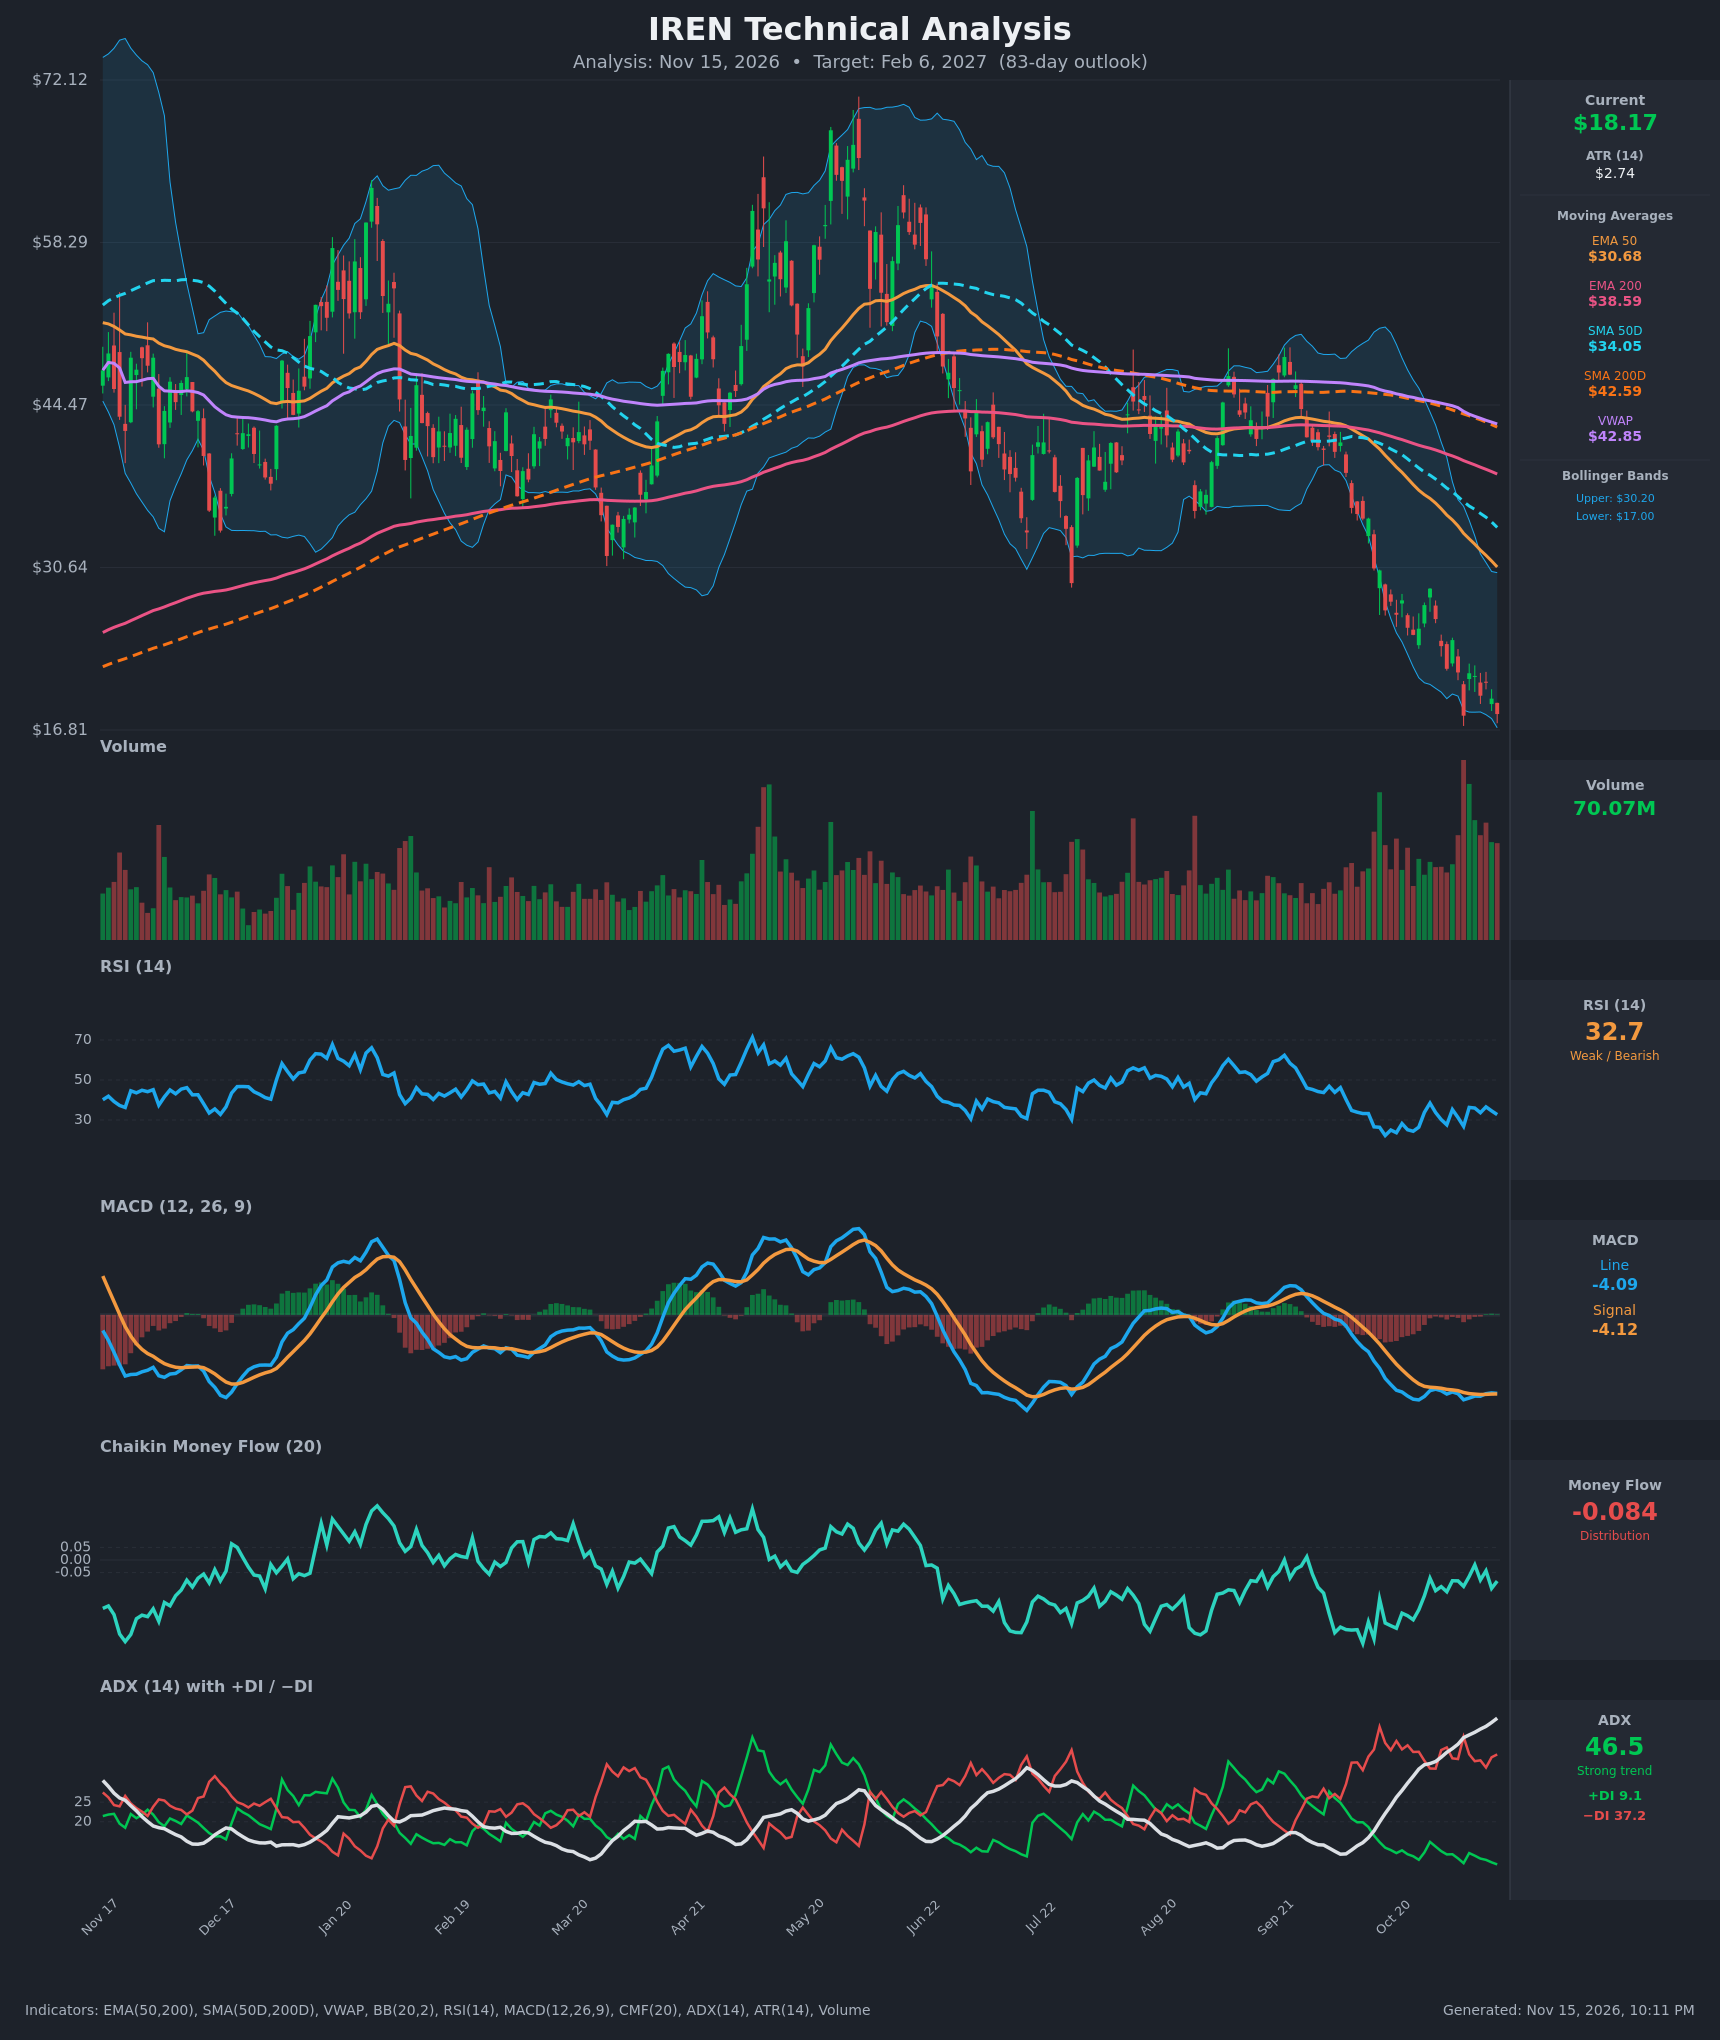
- RSI (14): 32.70, near oversold but not at the extreme. On Nov 5 price closed at $18.03 with RSI at 26.8. Today price is at a similar level ($18.17) with RSI about 6 points higher, so downside momentum is fading even though the trend is still down. [Neutral]
- 20 EMA: The 20 EMA isn't supplied, so I used the EMA 50 at $30.68 and EMA 200 at $38.59 as the dynamic-resistance proxies. Price is about 41% below the EMA 50, and the EMA 50 is below the EMA 200 (bearish stack). Any bounce runs into heavy overhead supply. [Bearish]
- MACD: Line -4.091 vs signal -4.120, giving a histogram of about +0.03. The line has just edged above the signal for the first time in about two weeks, but both sit deep in negative territory. This is a flattening of bearish momentum, not a real bullish reversal. [Neutral]
- Bollinger Bands (20): Upper $30.20, lower $17.00. Price at $18.17 hugs the lower band, which has been "walked" for several sessions. The wide band spacing shows very high volatility. Price is stretched, so a mean-reversion bounce toward the midline is possible, but band-walking also marks strong downtrends. [Bearish]
- CMF (20): -0.084, distribution (below -0.05). It has improved from -0.198 on Oct 26 and reached -0.020 on Nov 9, so selling pressure is easing, but it is still negative. [Distribution]
- ADX (14): 46.5 and rising, with −DI (37.2) far above +DI (9.1). This is a very strong downtrend with bears fully in control. Readings above 45 are historically extended and often come near trend exhaustion, but there is no sign of a DI crossover yet. [Strong Trend – Bearish]
- Volume: 70.07M, among the highest in the chart's history, with elevated volume throughout the October–November decline. Heavy volume at multi-month lows can signal capitulation, but confirmation needs a higher low plus a volume-backed up move. [Capitulation risk / Bearish until proven otherwise]
DIVERGENCES & TRENDS
- Bullish RSI divergence (minor): Price made an equal or slightly higher low ($18.17 vs $18.03 on Nov 5), while RSI rose from 26.8 to 32.7. MACD also made a slightly higher low (-4.09 vs -4.43).
- Long-term trend is decisively bearish: Price is far below the SMA 200 ($42.59), SMA 50 ($34.05), EMA 50, EMA 200 and VWAP ($42.85). The SMA 50 has crossed below the SMA 200 (death cross), and the EMA 50 is below the EMA 200.
- ADX/DI: ADX rose from 33.5 to 46.5 in 14 sessions, and +DI has collapsed to 9. This is a one-sided trend.
- MACD: A marginal bullish crossover occurred on Nov 11, but it is neither convincing nor confirmed by price.
- CMF: The recovery from -0.198 toward -0.08 shows selling intensity diminishing.
- Price action: The stock fell from about $44 in early Oct to $18, a drop of roughly 60%. It has been chopping between $18 and $24.5 for the last 2 weeks.
CHART PATTERNS
- Bullish Double Bottom (developing): Lows at $18.03 (Nov 5) and $18.17 (Nov 13) around the $24.46 swing high (Nov 3) and the $21–22 mid-pivots. A close above roughly $21.65–$24.50 would confirm it, with a measured move toward $24–$30. It is not yet confirmed, and the neckline is distant.
- Bearish continuation backdrop: The long decline from $44 resembles a flag or descending structure, with lower highs at $28.84 → $24.46 → $21.64. A loss of $17.00 would project a continuation toward $14–$15 (a Bearish Flag-style measured move).
- Significance: No pattern is confirmed. The market is at a decision point where the downtrend meets a possible double-bottom base.
POTENTIAL SCENARIOS
- Scenario 1: Bullish Double-Bottom Relief Bounce — Capitulation volume, a higher RSI low and a MACD cross let the stock base around $17–$18 and mean-revert toward the lower-high zone. Trigger: daily close above $21.65 with volume expansion, then above $24.50. Target: $21.50–$24.00 (the Bollinger midline and the EMA 50 at about $30 are too far for 83 days). Invalidation: daily close below $16.80. (42% probability)
- Scenario 2: Bearish Trend Continuation — ADX of 46.5 with −DI dominant and every moving average sloping down keeps sellers in control, and the lower BB breaks. Trigger: close below $17.00 / $16.81 on heavy volume. Target: $13.50–$15.00. Invalidation: close above $21.70. (40% probability)
- Scenario 3: Neutral Choppy Base — Price oscillates in a $16.50–$22.00 range as volatility compresses. Trigger: failure to break either $16.81 or $21.65 for several weeks. Target: about $18–$20. Invalidation: a decisive close outside the range on volume. (18% probability)
PRICE TARGETS
Timeframe is 83 days (the 61–180 day band: ~18–30% range width).
- Target Price: $19.40 (83 days)
- Expected Range: $15.80 to $21.20 (width $5.40, about 29.7% of the current price, within the 18–30% guidance)
- Key Levels: Support at $16.81, Resistance at $21.65
OVERALL BIAS
OVERALL BIAS: BULLISH - The trend is clearly bearish (death cross, price below all MAs, ADX 46.5 with −DI dominant), but an extended ADX, a lower-Bollinger-Band tag on capitulation-level volume, a higher RSI and MACD low versus Nov 5, and a fresh MACD cross favor a modest mean-reversion rally over 83 days. Conviction is modest, since a break below $16.81 would flip the bias to bearish.
This is educational analysis and not financial advice.