MARA 6-day bearish forecast — Nov 1, 2026
- Bias: Bearish
- Timeframe: 6 days (made Nov 1, 2026, target date Nov 6, 2026)
- Price at analysis: $6.76
- Price target: $6.60
- Expected range: $6.30 – $6.95
- Result: Correct (-6.1%) — closed at $6.35 on Nov 6, 2026; quality score 92/100
Get a free AI analysis of MARA today
Analysis
TECHNICAL INDICATORS
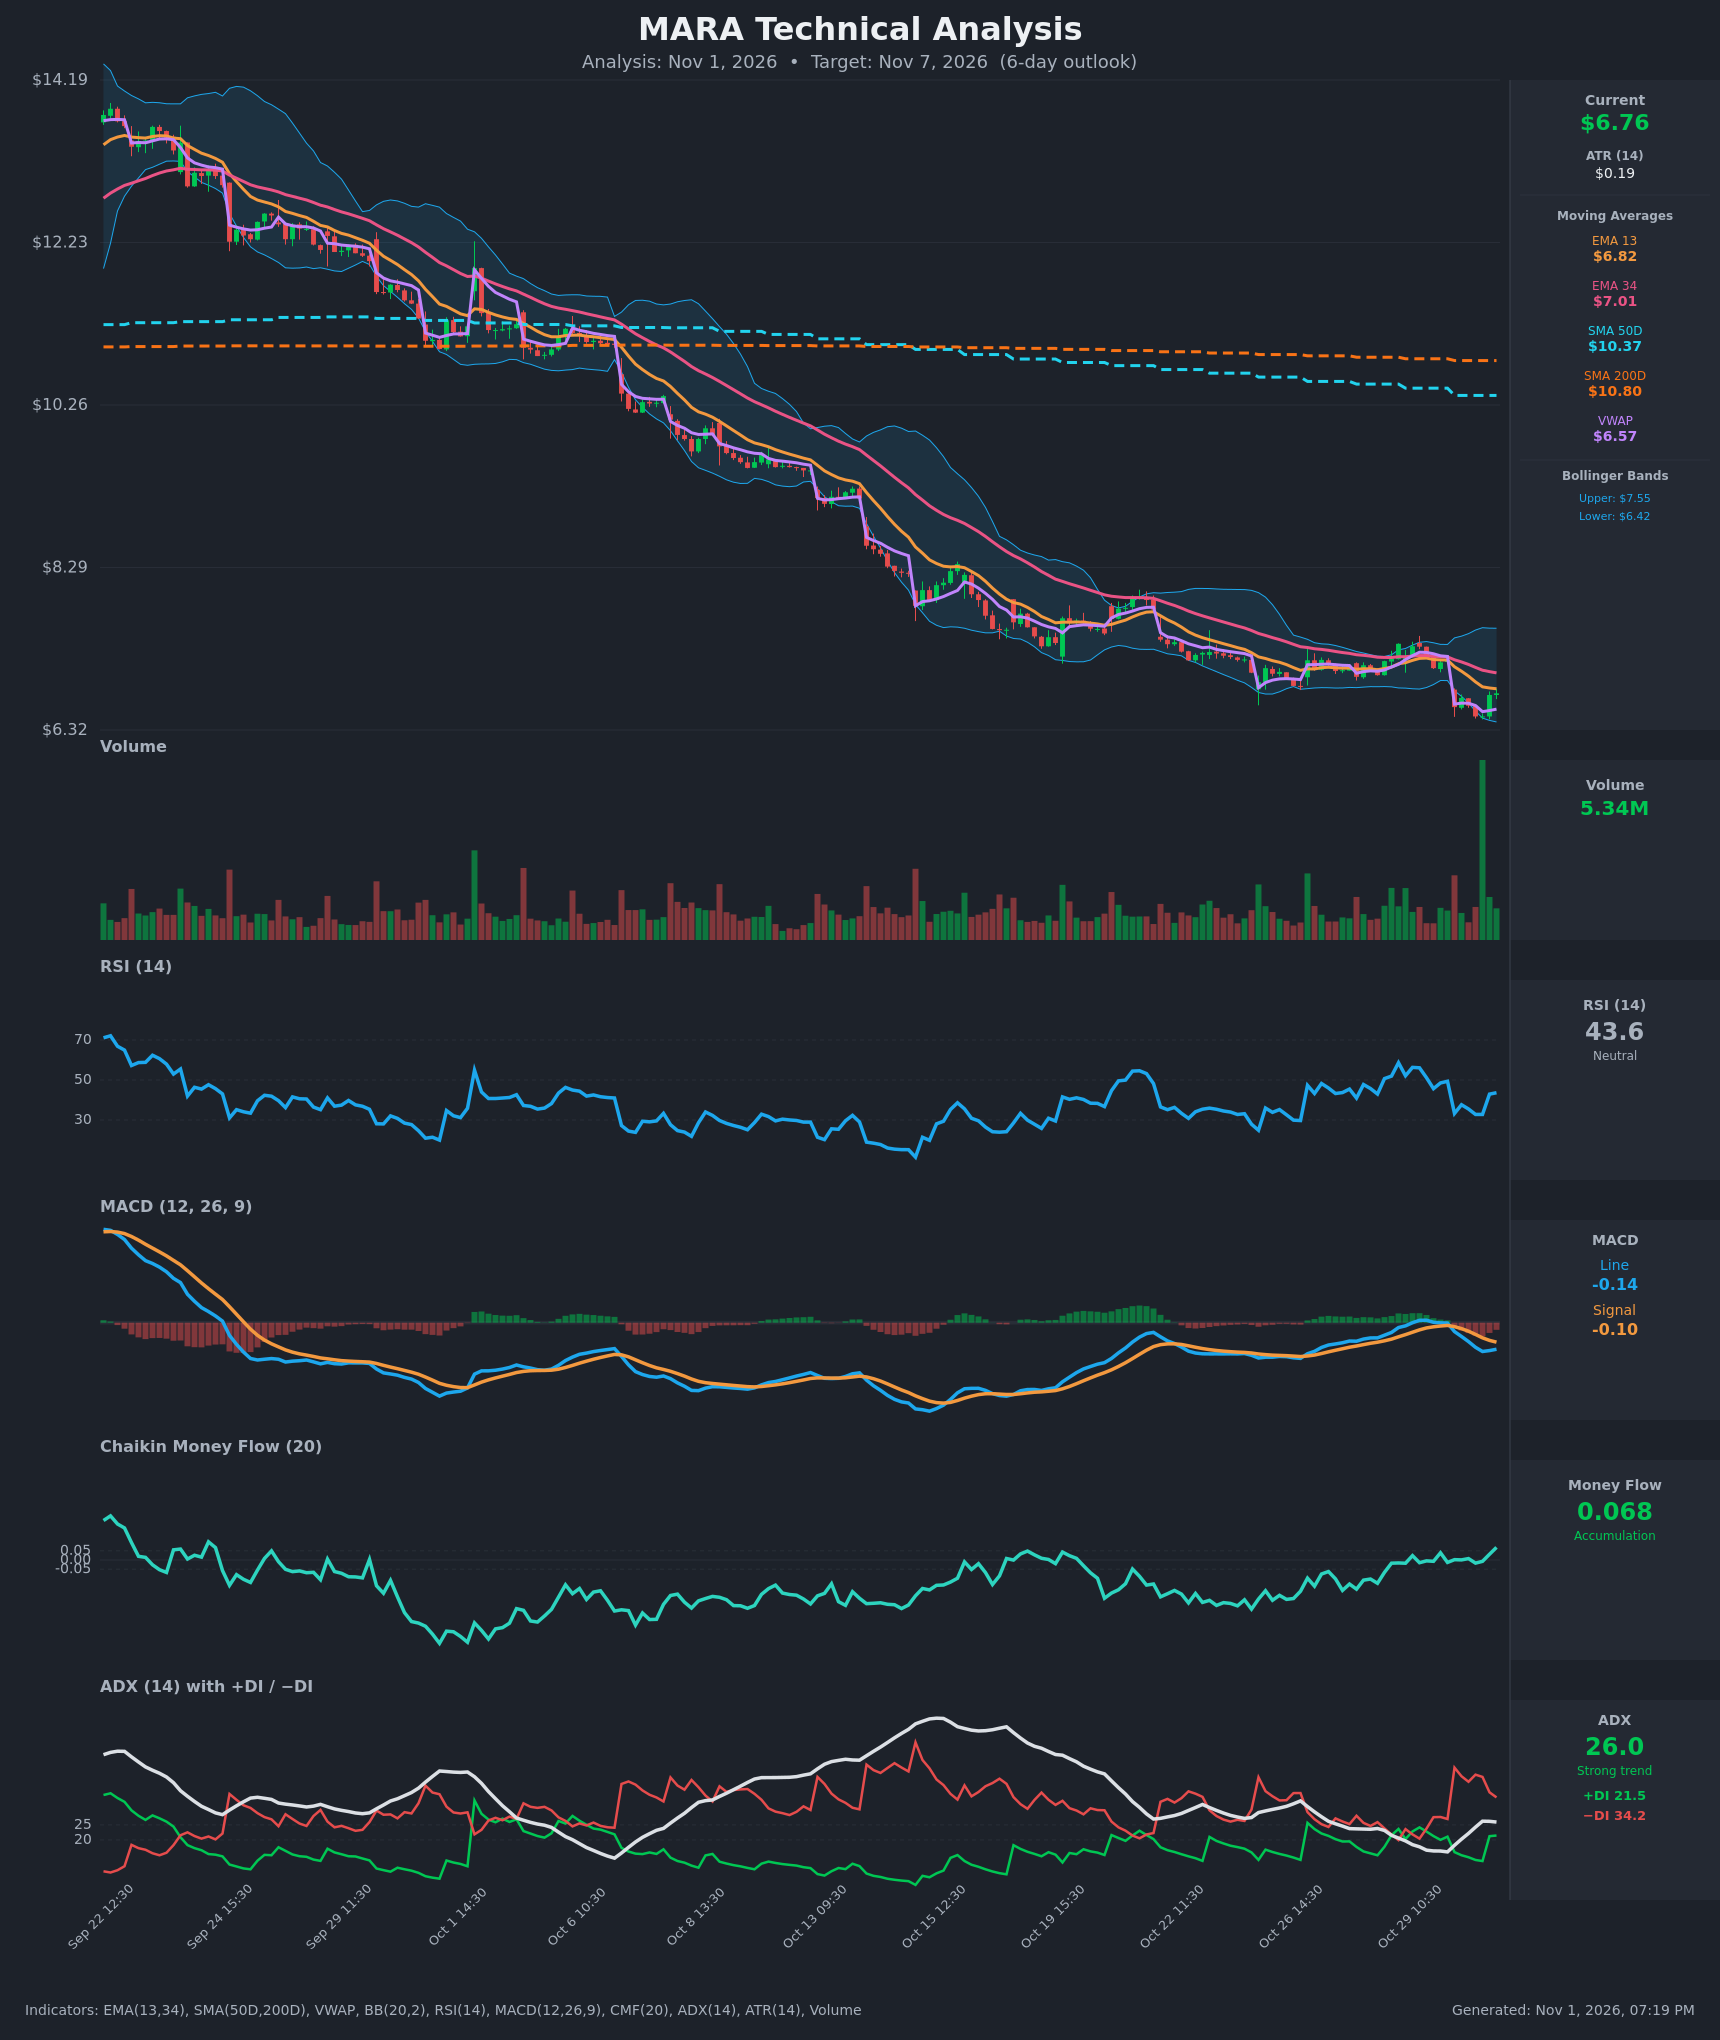
- RSI (14): 43.64. It bounced from 32.8 (oversold-adjacent) but remains below 50. Momentum is a weak recovery inside a downtrend, and the reading sits in neutral-to-bearish territory. [Neutral]
- EMA 13 / EMA 34: EMA13 is $6.82 and EMA34 is $7.01, with price at $6.765, below both. EMA13 has been below EMA34 since Oct 30 and the gap is widening. Both slope down and act as overhead resistance. [Bearish]
- MACD: Line -0.142 is below Signal -0.104, with a negative and widening histogram. The bearish crossover occurred on Oct 30 at the open, and both lines are rolling over from near zero. [Bearish]
- Bollinger Bands (20): Upper $7.55, lower $6.42, with price at $6.765 in the lower half of the bands. The bands are widening after the Oct 30 gap down. Price has bounced off the lower band but sits below the midline (about $6.99). [Bearish]
- CMF (20): +0.068, just above the +0.05 accumulation threshold and rising from slightly negative readings. That points to some dip buying, and the chart shows a large volume spike on the capitulation bar. It is a marginal reading and the first positive one in a long stretch. [Accumulation]
- ADX (14): 26.0, with −DI (34.2) well above +DI (21.5). The trend is strong and bearish, though ADX is flattening off its 26.2 peak and +DI is recovering. [Strong Trend – Bearish]
- Volume: 5.34M on the latest bar, with an enormous volume spike near the recent low. That reads as a possible selling climax or capitulation, but the bounce has not yet been confirmed by follow-through. [Possible capitulation; unconfirmed]
DIVERGENCES & TRENDS
- Long-term trend: Price ($6.77) is far below the SMA50D ($10.37) and SMA200D ($10.80). The SMA50D is below the SMA200D (death cross already in place). This is a persistent, deep downtrend that has fallen from about $14 to $6.7.
- Bullish divergence (mild): RSI made higher lows (about 33 on Oct 30 versus the earlier sub-30 readings in mid-October) while price made new lows. CMF has also climbed from deep negative to positive. These are early signs of selling exhaustion.
- Bearish confirmation: The MACD bearish crossover, the EMA13 < EMA34 stack, −DI dominance and the gap-down on Oct 30 all confirm the downtrend is still intact.
- Price action: The close recovered from $6.49 to $6.76 in the last two hours of Oct 30, a bounce with +DI rising. The bounce is still below VWAP-adjacent resistance levels and the EMAs.
CHART PATTERNS
- Bearish Rising Wedge/Flag continuation in earlier sections: The long staircase decline of lower highs and lower lows, with minor consolidations, resembles repeated Bearish Flag/Pennant continuation patterns. The latest consolidation near $7.00–$7.40 broke down on the Oct 30 gap.
- Possible base: The $6.49–$6.76 area shows a tentative Bullish Double Bottom (two lows at about $6.49), with a neckline near $7.00–$7.10. It is not confirmed. A move above $7.10 would target about $7.60, a measured move of roughly $0.60.
- Until the neckline breaks, the dominant structure is a downtrend continuation, with a downside measured target of about $6.30 from the broken consolidation.
POTENTIAL SCENARIOS
- Scenario 1: Bearish Trend Continuation — The bounce stalls beneath the EMA13 ($6.82) and EMA34 ($7.01), and sellers retest the $6.49 low. Trigger: Rejection at $6.82–$6.90 and a break below $6.49. Target: $6.30–$6.45. Invalidation: Daily/hourly close above $7.01. (50% probability)
- Scenario 2: Bullish Relief Bounce / Double Bottom — Capitulation volume and positive CMF fuel a mean-reversion bounce to the band midline. Trigger: Break above $6.90 and then $7.01 (EMA34). Target: $7.20–$7.50. Invalidation: Close below $6.49. (30% probability)
- Scenario 3: Neutral Chop — Price oscillates between $6.45 and $7.00 as the capitulation bounce is absorbed. Trigger: Failure to break either $6.49 or $7.01. Target: $6.70–$6.85. Invalidation: Decisive break of either boundary. (20% probability)
PRICE TARGETS
Timeframe: 6 days (range scaled to 4–8% of current price; the ~6.5% width below reflects the range width).
- Target Price: $6.60
- Expected Range: $6.30 to $6.95 (width $0.65 ≈ 9.6% of price, which fits the high volatility; ATR of $0.19 implies roughly $0.46 over 6 days, so the range covers about 1.4× that)
- Key Levels: Support at $6.49, Resistance at $6.82
OVERALL BIAS
OVERALL BIAS: BEARISH - Price sits below all key moving averages with a fresh MACD bearish crossover, −DI far above +DI and ADX above 25, so the dominant trend is still down. The capitulation volume and improving CMF argue for a bounce, but overhead resistance at $6.82–$7.01 likely caps it.
This is educational analysis and not financial advice.