MARA 48-day bullish forecast — Nov 15, 2026
- Bias: Bullish
- Timeframe: 48 days (made Nov 15, 2026, target date Jan 1, 2027)
- Price at analysis: $6.99
- Price target: $7.25
- Expected range: $6.25 – $7.50
- Result: Pending — graded after the close on Jan 1, 2027
Get a free AI analysis of MARA today
Analysis
TECHNICAL INDICATORS
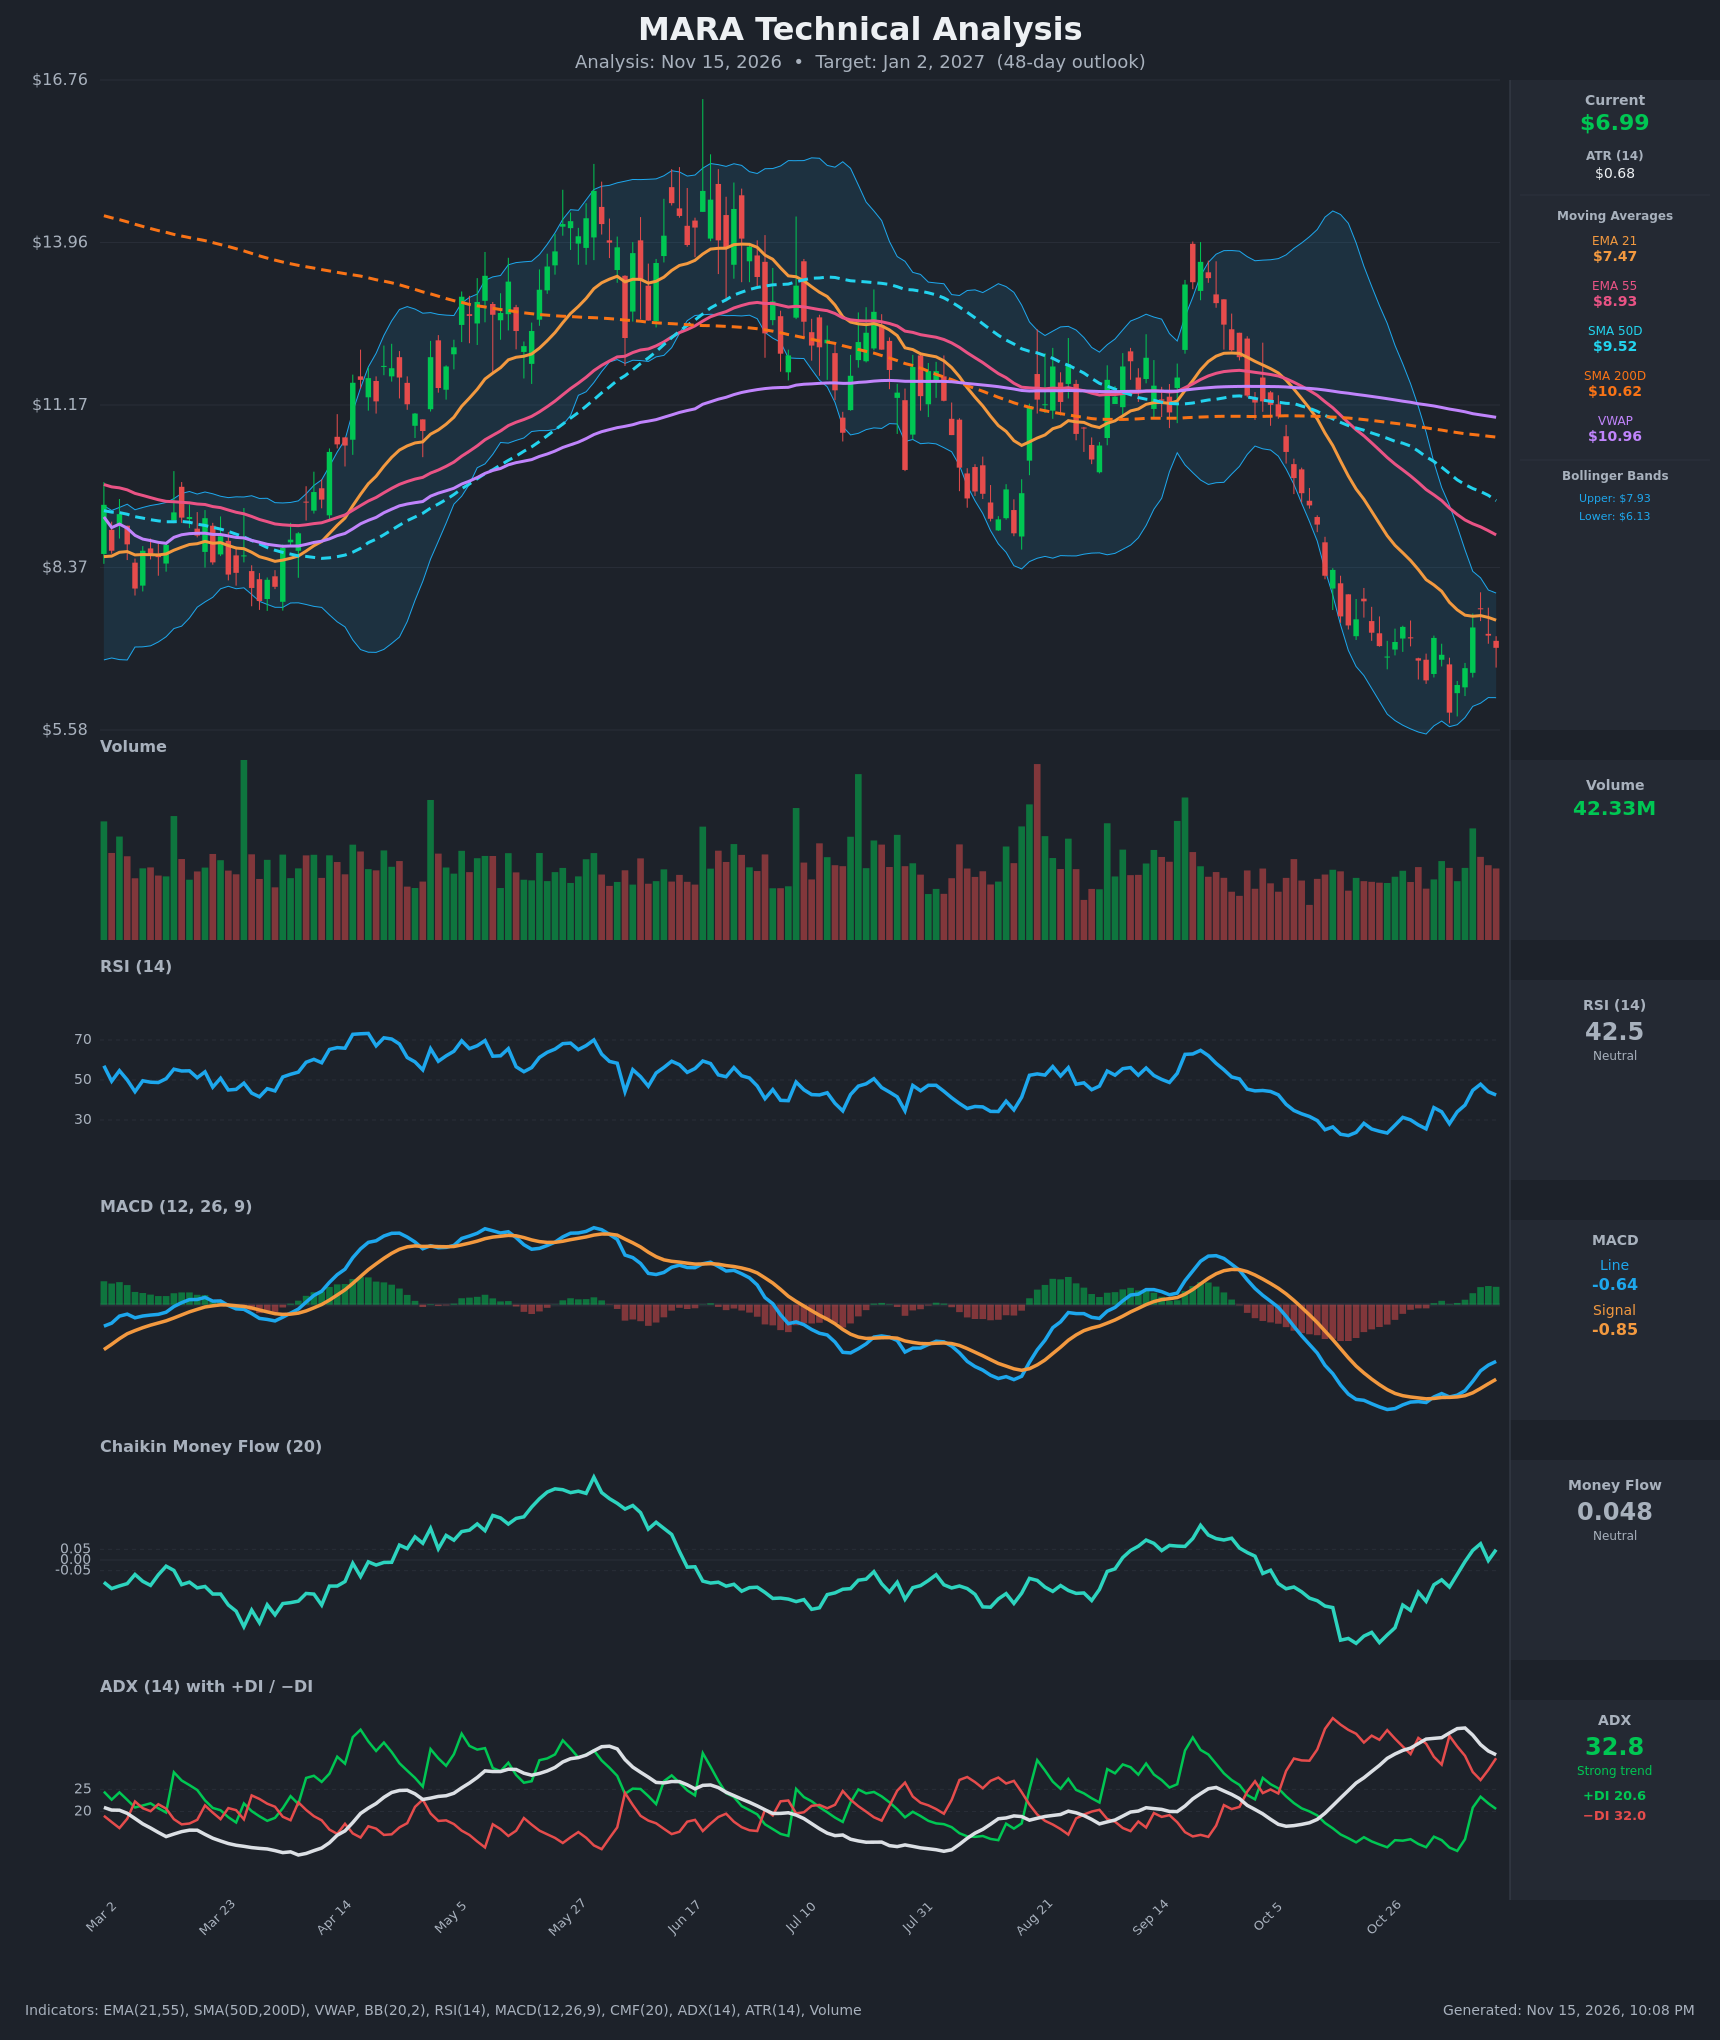
- RSI (14): 42.5, recovering from deeply oversold (23.5 on Oct 26) but turned down from 47.9 on Nov 11. It is making higher lows versus the Oct/Nov trough, but it is still below 50, where the prior downtrend has capped it. [Neutral]
- 20 EMA: The 21 EMA is $7.47 and price at $6.99 is below it, so it acts as resistance. The EMA stack is fully bearish (EMA21 $7.47 < EMA55 $8.93 < SMA50 $9.52 < SMA200 $10.62). Price closed above EMA21 on Nov 10-11 but could not hold it. [Bearish]
- MACD: The line (-0.643) is above the signal (-0.846), a bullish crossover that happened around Nov 3. The histogram is positive and expanding, and the line has made a higher low versus the Oct trough. Both lines are still below zero, so this is a relief bounce, not a confirmed trend change. [Bullish]
- Bollinger Bands (20): Upper $7.93, lower $6.13, midline about $7.03. Price sits right at the midline after a bounce from the lower band, which was tagged at $5.88. The bands are narrowing from the earlier wide expansion, so volatility is compressing. [Neutral]
- CMF (20): 0.048, up from -0.352 on Oct 26. It is flipping from heavy distribution to just under the accumulation threshold. This is a clear improvement but not yet decisive. [Neutral]
- ADX (14): 32.8, falling from a 38.9 peak. −DI (32.0) is above +DI (20.6), so bears still control, but the gap has narrowed from 26 points to about 11. The downtrend is still strong but losing steam. [Strong Trend - Bearish, fading]
- Volume: 42.33M, in line with recent averages. There was a volume spike on the bounce bar (Nov 10), but no capitulation-sized volume. The recent green bars are slightly heavier than the red, which hints at modest accumulation. [Mildly Bullish / Neutral]
DIVERGENCES & TRENDS
- Bullish divergence: Price made a lower low ($5.88 on Nov 5) while MACD and RSI made higher lows than the Oct 26-Nov 2 troughs. RSI was 28 at the Nov 5 low versus 23.5 earlier, and MACD histogram turned positive.
- CMF trend: It has risen steadily from -0.35 to +0.05, showing selling pressure has been absorbed.
- ADX: It is rolling over from a peak at 38.9, which often precedes a pause or a bottoming phase, but it has not yet confirmed a reversal.
- Moving averages: A death cross is already in place (SMA50 below SMA200), and price is below SMA200 and VWAP ($10.96). The long-term trend is firmly down.
- MACD: A bullish signal-line crossover has occurred, but below zero.
- Price action: The Nov 11 high of $7.66 was rejected at the EMA21 and Bollinger midline, and price has since pulled back to $6.99.
CHART PATTERNS
- Possible Bullish Double Bottom / base: The $5.88 low and the $6.43 low define a basing zone, with the $7.66 high as the neckline. A close above $7.66 would target roughly $9.40 (measured move), though that is beyond the 48-day expectation.
- Bearish Flag risk: The bounce from $5.88 to $7.66 and the pullback follow a sharp prior decline. A breakdown below $6.43 would resume the downtrend toward $5.50 or lower.
- Neither pattern is confirmed, so the structure is a transition zone inside a larger downtrend.
POTENTIAL SCENARIOS
- Scenario 1: Bullish Base and Relief Grind — Momentum divergences and improving CMF support a higher-low base, with price retesting the EMA21/Bollinger upper zone. Trigger: hold above $6.43 and a close above $7.47 (EMA21). Target: $7.65-$8.00, with an extension toward $8.93 (EMA55) only on a $7.66 breakout. Invalidation: daily close below $6.13. (45% probability)
- Scenario 2: Bearish Trend Resumption — The bounce fails at declining moving averages, and −DI dominance and the death-cross structure pull price to new lows. Trigger: close below $6.43, then below $5.88. Target: $5.50-$5.80. Invalidation: close above $7.66. (38% probability)
- Scenario 3: Neutral Range Chop — Price oscillates between $6.13 and $7.66 as ADX decays and the Bollinger Bands squeeze. Trigger: failure to break either $5.88 or $7.66. Target: $6.60-$7.30. Invalidation: close outside the $5.88-$7.66 range. (17% probability)
PRICE TARGETS
- Target Price: $7.25 (48 days, Jan 2, 2027)
- Expected Range: $6.25 to $7.50 (width $1.25, about 17.9% of current price, consistent with the 30-60 day guidance)
- Key Levels: Support at $6.43, Resistance at $7.66
OVERALL BIAS
OVERALL BIAS: BULLISH - Bullish MACD crossover, higher momentum lows against price, and CMF recovering from -0.35 to +0.05, with a fading ADX and price bouncing off the lower Bollinger Band, favor a modest relief advance. The conviction is modest because price is still below every major moving average and −DI remains above +DI.
This is educational analysis and not financial advice.