MARA 34-day bullish forecast — Nov 15, 2026
- Bias: Bullish
- Timeframe: 34 days (made Nov 15, 2026, target date Dec 18, 2026)
- Price at analysis: $6.99
- Price target: $7.40
- Expected range: $6.35 – $7.55
- Result: Pending — graded after the close on Dec 18, 2026
Get a free AI analysis of MARA today
Analysis
TECHNICAL INDICATORS
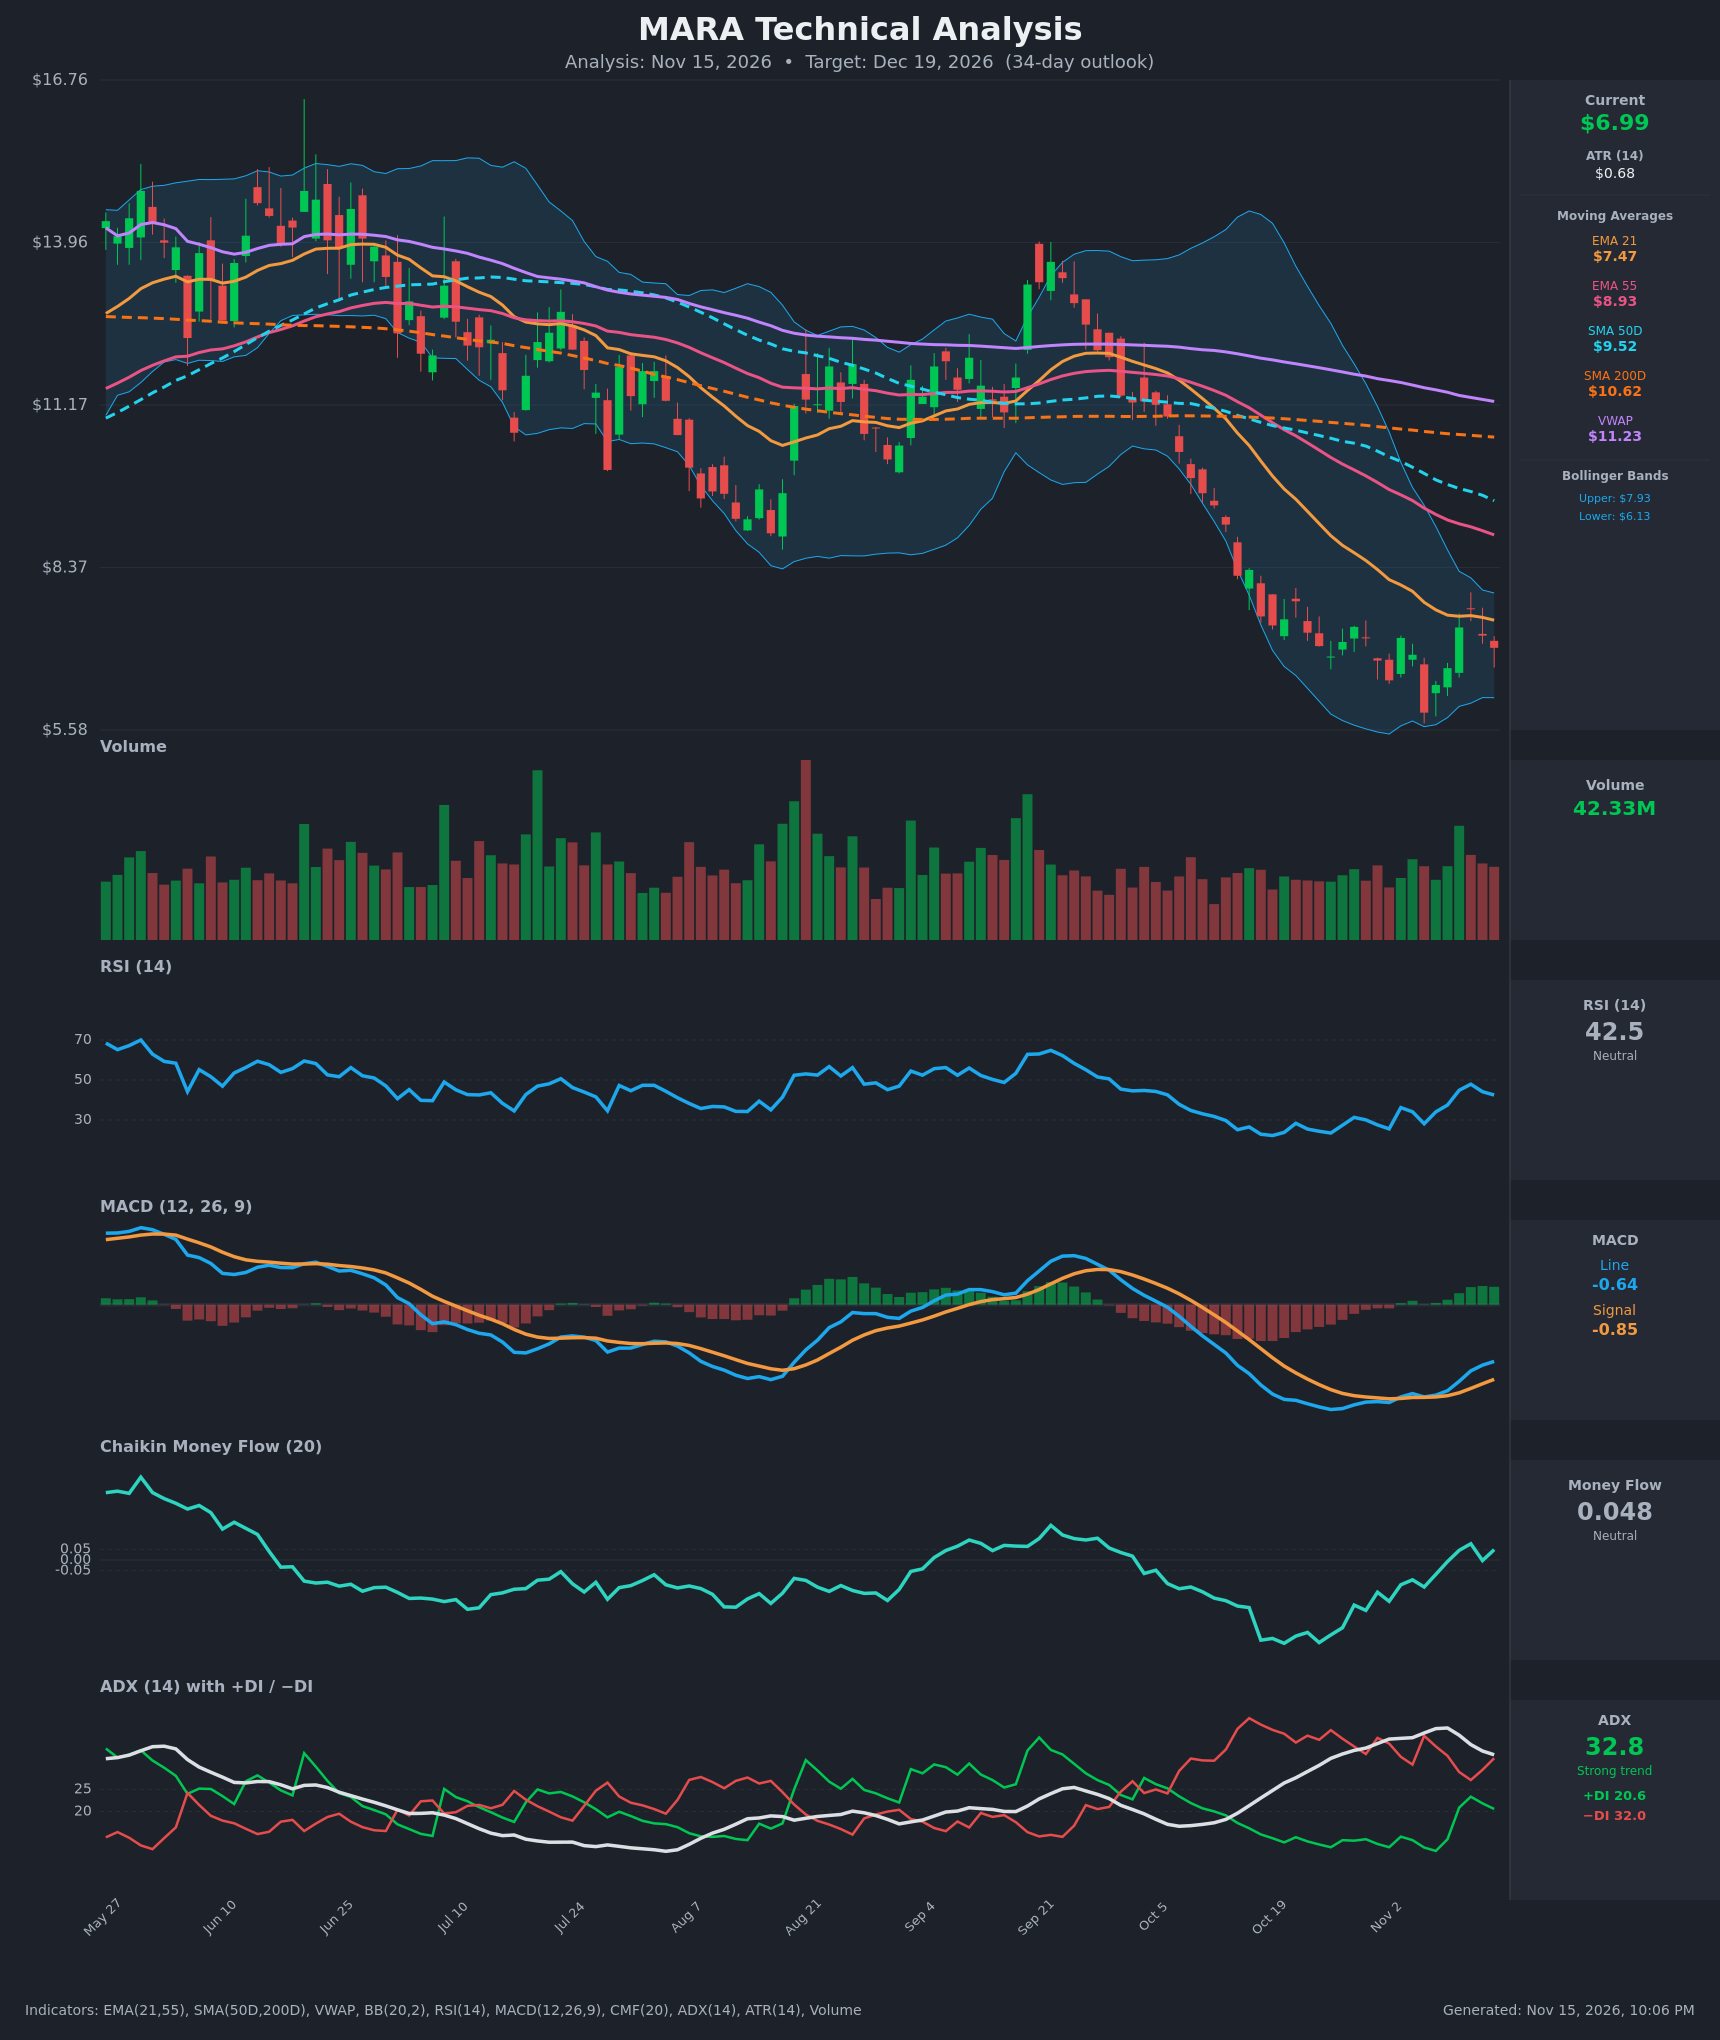
- RSI (14): 42.50, up from an oversold 23.5 on Oct 26 and a 28.1 low on Nov 5. It peaked at 47.9 on Nov 11 and has since eased back. The price low at $5.88 came with a higher RSI low than October's, which is a bullish divergence. RSI is still below 50, so the recovery is not yet confirmed. [Neutral]
- 20 EMA (EMA 21): $7.4654. Price at $6.99 is below it, and the EMA is still falling (from $8.92 on Oct 26). Price was rejected near it on Nov 11 ($7.66 close vs $7.54). EMA21 is also below EMA55 ($8.93), so the bearish alignment persists. [Bearish]
- MACD: Line -0.643 is above Signal -0.846, so the histogram is positive (+0.20) and rising. The bullish crossover happened around Nov 10. Both lines are still below zero, so this is a rebound within a downtrend rather than a trend reversal. [Bullish]
- Bollinger Bands (20): Upper $7.93, lower $6.13, with price near the middle of the band. The bands have contracted sharply after the October selloff, and price has moved off the lower band. This suggests volatility compression and a mean-reversion bounce that has stalled mid-band. [Neutral]
- CMF (20): 0.048, just under the +0.05 accumulation threshold. It has risen from -0.352 on Oct 26 and briefly crossed above zero on Nov 10-11. Selling pressure has faded and buying pressure is slowly building. [Neutral]
- ADX (14): 32.8 with +DI 20.6 and −DI 32.0. This is a strong trend, but ADX is falling from a 38.9 peak and −DI is declining while +DI rises. Bears are still in control, but the downtrend is losing strength. [Strong Trend – Bearish, weakening]
- Volume: 42.33M, in line with recent averages. Volume spiked on the Nov 10 rebound candle, and the latest bars show modest selling volume. Heavy volume on the bounce suggests dip-buying interest, but it is not yet a decisive reversal. [Neutral / slightly constructive]
- Moving averages and VWAP: Price is below SMA50D ($9.52), SMA200D ($10.62) and VWAP ($11.23). SMA50D is below SMA200D, so the death cross is in place. All of these sit overhead as resistance. [Bearish]
DIVERGENCES & TRENDS
- Bullish RSI divergence: Price made a lower low at $5.88 (Nov 5), but RSI bottomed at 28.1, above the 23.5 low of Oct 26.
- Momentum turning up: The MACD bullish crossover came around Nov 10, and the histogram has turned positive. CMF has climbed from -0.35 to +0.05.
- Trend still down: Price is below every moving average, EMA21 < EMA55 and SMA50 < SMA200. −DI (32.0) is well above +DI (20.6). A bullish DI crossover has not occurred.
- Failed follow-through: Price rallied to $7.66 on Nov 11 and then pulled back to $6.99. Because of this, the rebound is not yet a higher-high structure.
- Overhead supply: EMA21 ($7.47) and the upper Bollinger Band ($7.93) form the first resistance cluster. EMA55 ($8.93) and SMA50D ($9.52) are the next major ceilings.
CHART PATTERNS
- Possible Bullish Double Bottom / base (loose): Lows at $6.43 (Nov 2) and $5.88 (Nov 5), with a neckline near $7.66. A close above the neckline would project roughly $8.5-$9.0, though this is a stretch for 34 days. The two lows are not equal, so the pattern is imperfect.
- Bullish Falling Wedge (loose): The October-November decline has narrowed into a series of lower highs and slightly higher momentum lows, with volatility compression in the Bollinger Bands. A breakout above about $7.66 would favor a move toward the EMA55 area.
- Bearish Flag risk: The bounce from $5.88 to $7.66 and the pullback could be a bear flag after the sharp October drop. A break below $6.40 would target the $5.88 low and lower, which is the main bearish alternative.
POTENTIAL SCENARIOS
- Scenario 1: Bullish Relief Rally to the EMAs — The bullish MACD cross, RSI divergence and recovering CMF carry price above EMA21 and toward the upper band as sellers exhaust. Trigger: daily close above $7.66, with CMF above +0.05 and RSI above 50. Target: $7.40-$7.95, with an extension to $8.50. Invalidation: close below $6.40. (45% probability)
- Scenario 2: Bearish Downtrend Resumption — Price fails at EMA21 resistance, and the strong ADX/−DI trend pulls it back to retest or break the Nov 5 low (bear-flag outcome). Trigger: close below $6.40 with CMF turning negative and MACD rolling over. Target: $5.88, then $5.40. Invalidation: close above $7.70. (38% probability)
- Scenario 3: Neutral Choppy Basing — Price consolidates between $6.40 and $7.60 as ADX fades and the bands stay tight. Trigger: repeated failures at EMA21 with holds above $6.40. Target: $6.80-$7.20. Invalidation: a close outside the $6.40-$7.66 range. (17% probability)
PRICE TARGETS
- Target Price: $7.40 (34-day)
- Expected Range: $6.35 to $7.55. The width is $1.20, about 17% of the current price, which fits the 30-60 day guidance.
- Key Levels: Support at $6.13, Resistance at $7.66
OVERALL BIAS
OVERALL BIAS: BULLISH - A bullish MACD crossover, an RSI higher-low divergence and CMF recovering to about +0.05 point to a relief rally. The falling ADX and −DI also show the downtrend losing strength, with a mean-reversion target near EMA21 and the Bollinger midline-to-upper band. Conviction is modest because price remains below all major moving averages in a confirmed downtrend.
This is educational analysis and not financial advice.