MARA 83-day bearish forecast — Nov 15, 2026
- Bias: Bearish
- Timeframe: 83 days (made Nov 15, 2026, target date Feb 5, 2027)
- Price at analysis: $6.99
- Price target: $6.45
- Expected range: $5.50 – $7.40
- Result: Pending — graded after the close on Feb 5, 2027
Get a free AI analysis of MARA today
Analysis
TECHNICAL INDICATORS
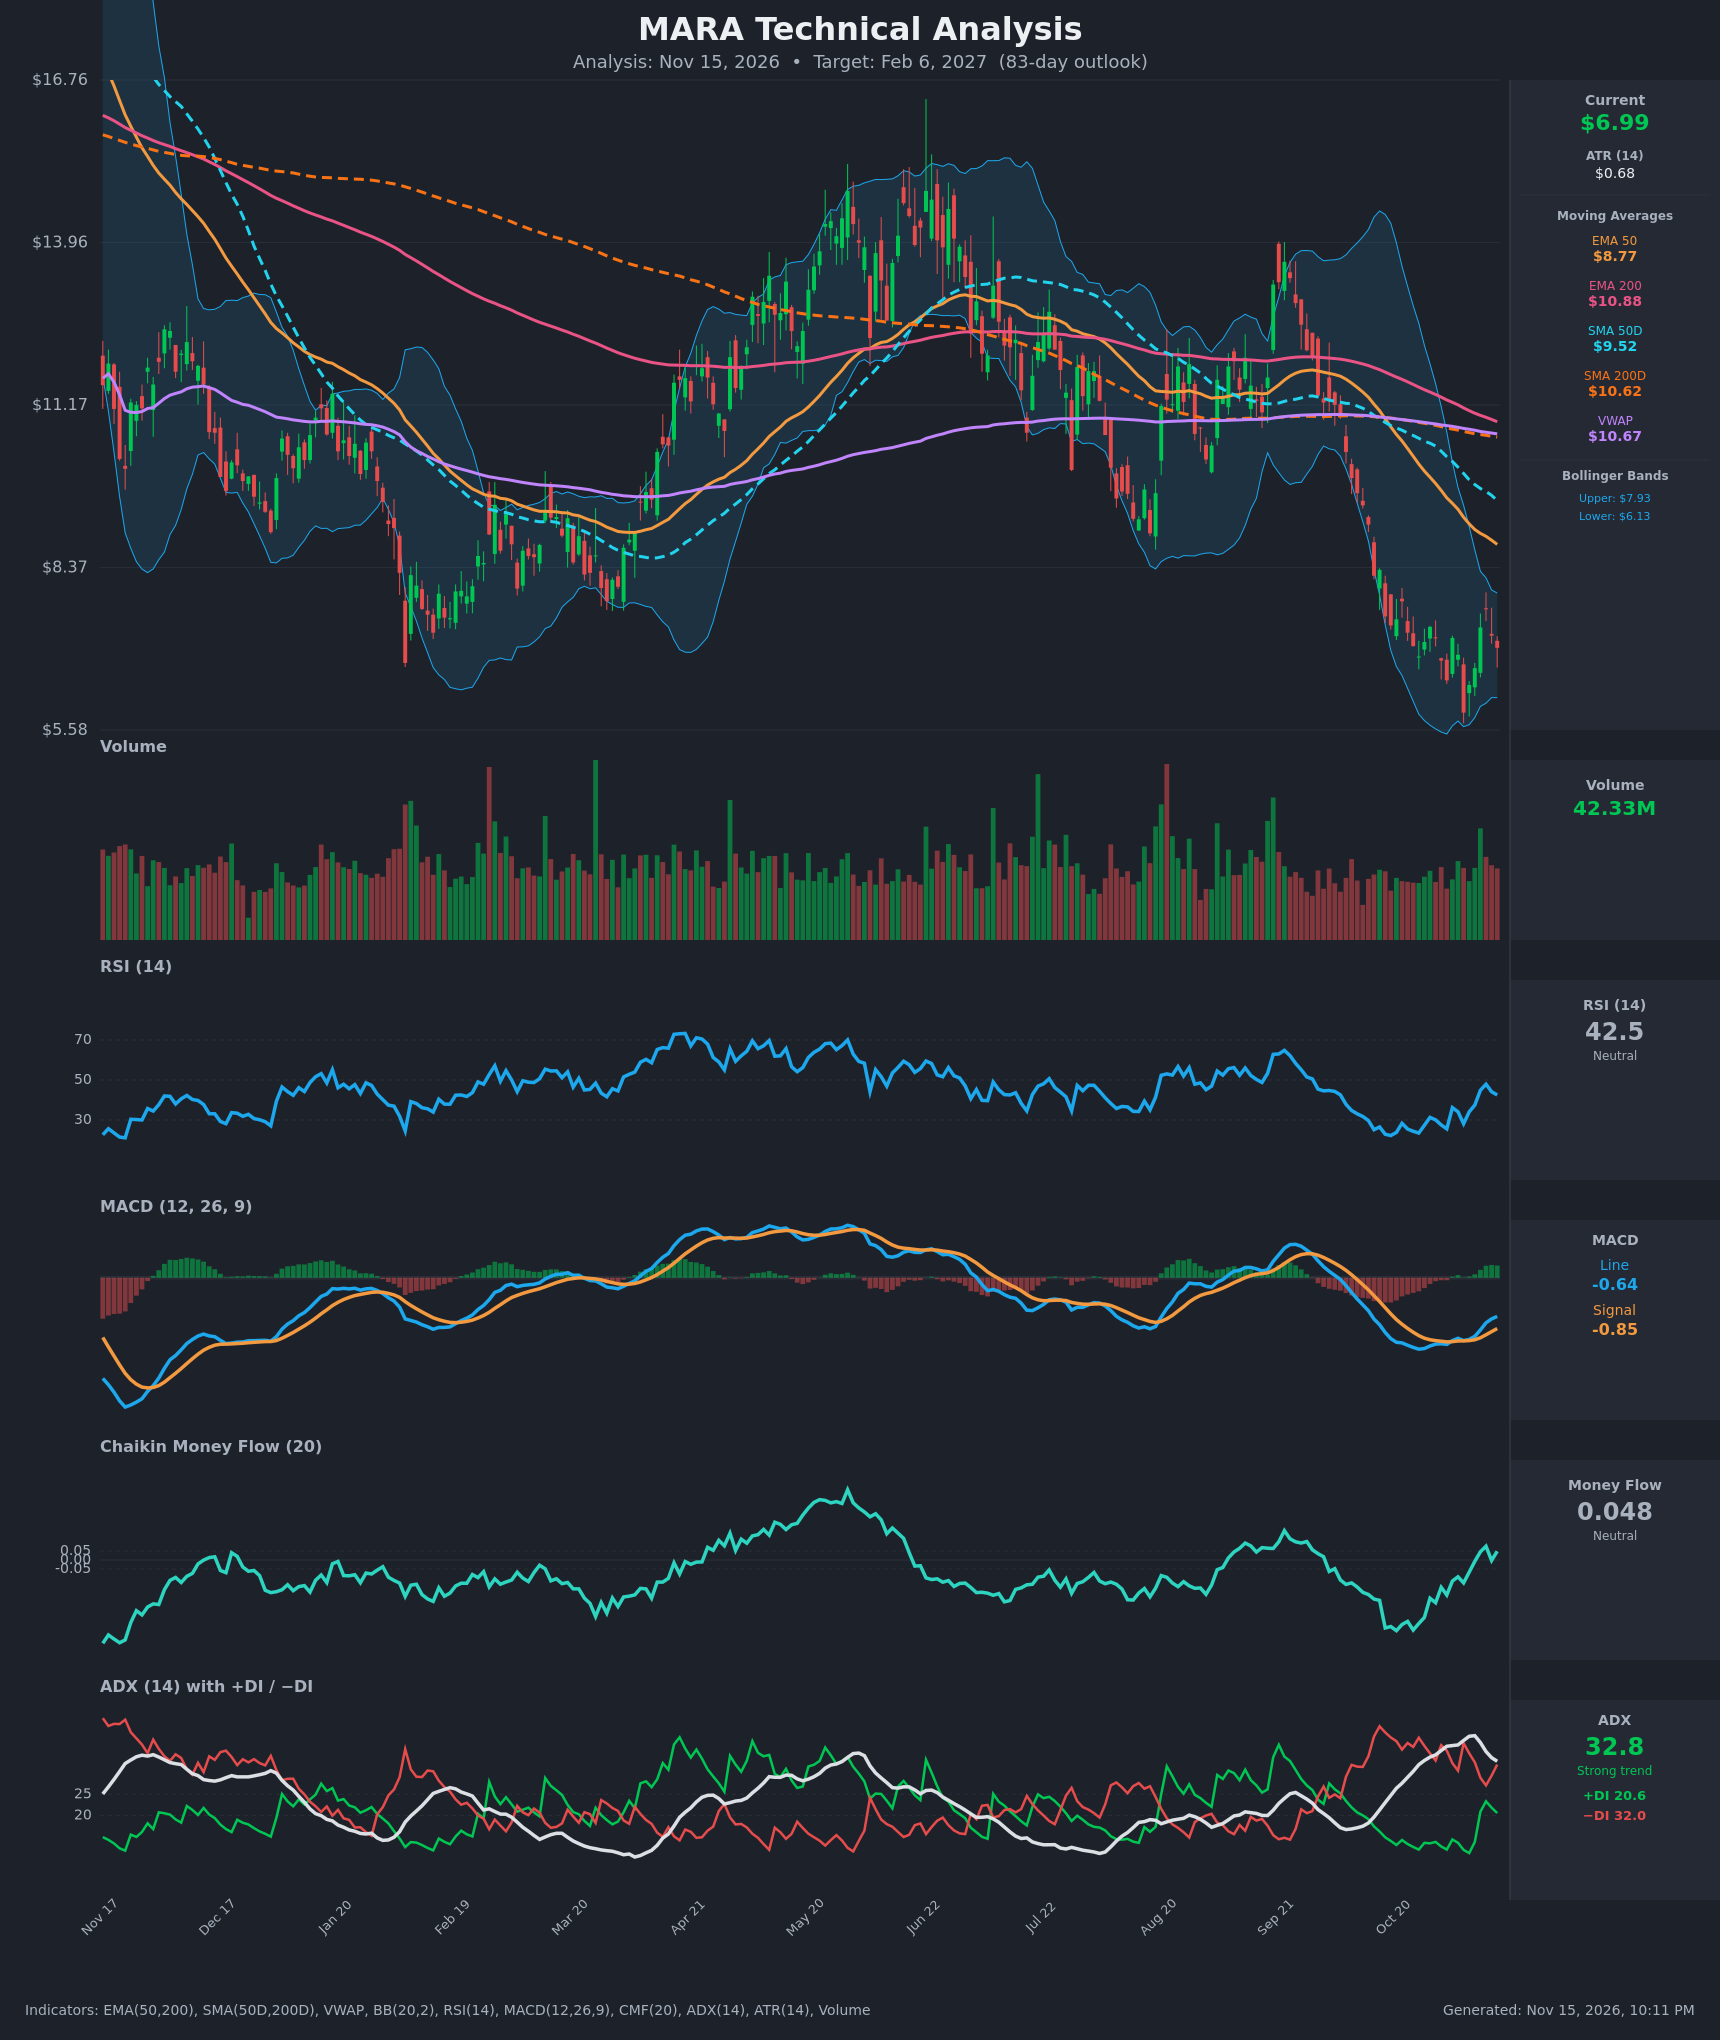
- RSI (14): 42.50, up from an oversold 23.5 on Oct 26 but turned down from 47.9 on Nov 11. The bounce stalled below the 50 midline, which is typical of a relief rally inside a downtrend. [Neutral]
- 20 EMA: The 20 EMA isn't supplied. The 20-period Bollinger midline (about $7.03) is its proxy, and price at $6.99 sits just below it. The EMA50 ($8.77) and EMA200 ($10.88) are well above and falling, so rallies meet layered resistance. [Bearish]
- MACD: Line -0.643 is above signal -0.846, a bullish crossover that happened around Nov 3. The histogram is about +0.20 and expanding, but everything remains deep below zero. This is a momentum recovery, not a confirmed trend change. [Bullish]
- Bollinger Bands (20): Upper $7.93, lower $6.13, midline about $7.03. Price came off the lower band (the $5.88 low pierced it) and is now pinned at the midline. The bands are still tilted down, so the midline is acting as resistance. [Neutral]
- CMF (20): 0.048, up from -0.35 on Oct 26 and just under the +0.05 accumulation threshold. Selling pressure has faded and buyers are stepping in, but it has flipped between slightly positive and negative in the last few days. [Neutral]
- ADX (14): 32.8 and easing from 38.9, with -DI (32.0) well above +DI (20.6). The trend is strong and bearish, but weakening, and +DI has recovered from 11 to 20 while -DI has fallen. [Strong Trend – Bearish]
- Volume: 42.33M, roughly in line with recent levels and without a capitulation spike or a clear accumulation surge. The bounce from $5.88 came on modest volume, so there is little conviction behind it. [Neutral/Weak confirmation of the bounce]
DIVERGENCES & TRENDS
- Death crosses in place: EMA50 is below EMA200 and SMA50D is below SMA200D, with the gaps still widening. Price is below the SMA200D ($10.62), EMA200 and VWAP ($10.67), a confirmed long-term downtrend.
- Bullish momentum divergence: Price made a lower low at $5.88 on Nov 5, but RSI (28.1 vs 23.5) and MACD (-1.046 vs -1.188) made higher lows. This suggests selling is exhausting.
- MACD crossover: The bullish cross below zero is a relief signal, not a trend reversal.
- DI spread: -DI is still ahead by about 11 points. +DI has not crossed above -DI.
- Failed bounce: Price rejected at $7.66 (Nov 11) and has since made lower highs ($7.34, $7.66, $7.20, $6.99), close to the Bollinger midline.
CHART PATTERNS
- Bearish continuation structure: After a steep decline from about $11 to $5.88, price is consolidating in a $5.88–$7.66 range under falling averages. This is closest to a bearish flag/pennant from the reference diagram. A break below $5.88 would project roughly $4.50–$5.00, using the measured move from the prior leg.
- Possible Bullish Double Bottom / Falling Wedge: The Oct 30 low ($6.43), the Nov 5 low ($5.88) and the higher-low momentum hint at a base. It would be confirmed only by a close above the $7.66 neckline, which targets about $8.80–$9.50 (the EMA50 and SMA50D area). It is not confirmed yet.
POTENTIAL SCENARIOS
- Scenario 1: Bearish Trend Continuation — The relief bounce fades at the midline and falling EMA50, and sellers retake control, since -DI is dominant and price is below every major average. Trigger: Rejection at $7.03–$7.66, then a daily close below $6.43. Target: $5.50–$6.00, with an extension toward $5.00 if $5.88 breaks. Invalidation: Daily close above $8.00 with +DI crossing above -DI. (45% probability)
- Scenario 2: Bullish Base and Relief Rally — Momentum divergence and improving CMF produce a double-bottom breakout. Trigger: Close above $7.66 on rising volume. Target: $8.77–$9.50 (EMA50 and SMA50D). Invalidation: Close below $5.88. (33% probability)
- Scenario 3: Neutral Range-Bound Chop — Price oscillates between $5.90 and $7.70 for the whole period as the ADX fades. Trigger: Repeated failures at both $7.66 and $5.88. Target: $6.50–$7.30. Invalidation: Close outside the $5.88–$7.66 range. (22% probability)
PRICE TARGETS
- Target Price: $6.45 (83-day horizon)
- Expected Range: $5.50 to $7.40 (width $1.90, about 27% of the current price, in line with the 61–180 day guidance)
- Key Levels: Support at $5.88, Resistance at $7.66
OVERALL BIAS
OVERALL BIAS: BEARISH - Price is below all major moving averages with death crosses in place, and the ADX is strong at 32.8 with -DI well above +DI. The MACD cross, the RSI divergence and the CMF recovery argue for a bounce, but the bounce has been rejected at the Bollinger midline with weak volume. Conviction is modest, and a close above $7.66 would shift the balance toward the bulls.
This is educational analysis and not financial advice.