MARA 62-day bearish forecast — Nov 15, 2026
- Bias: Bearish
- Timeframe: 62 days (made Nov 15, 2026, target date Jan 15, 2027)
- Price at analysis: $6.99
- Price target: $6.40
- Expected range: $4.95 – $7.90
- Result: Pending — graded after the close on Jan 15, 2027
Get a free AI analysis of MARA today
Analysis
TECHNICAL INDICATORS
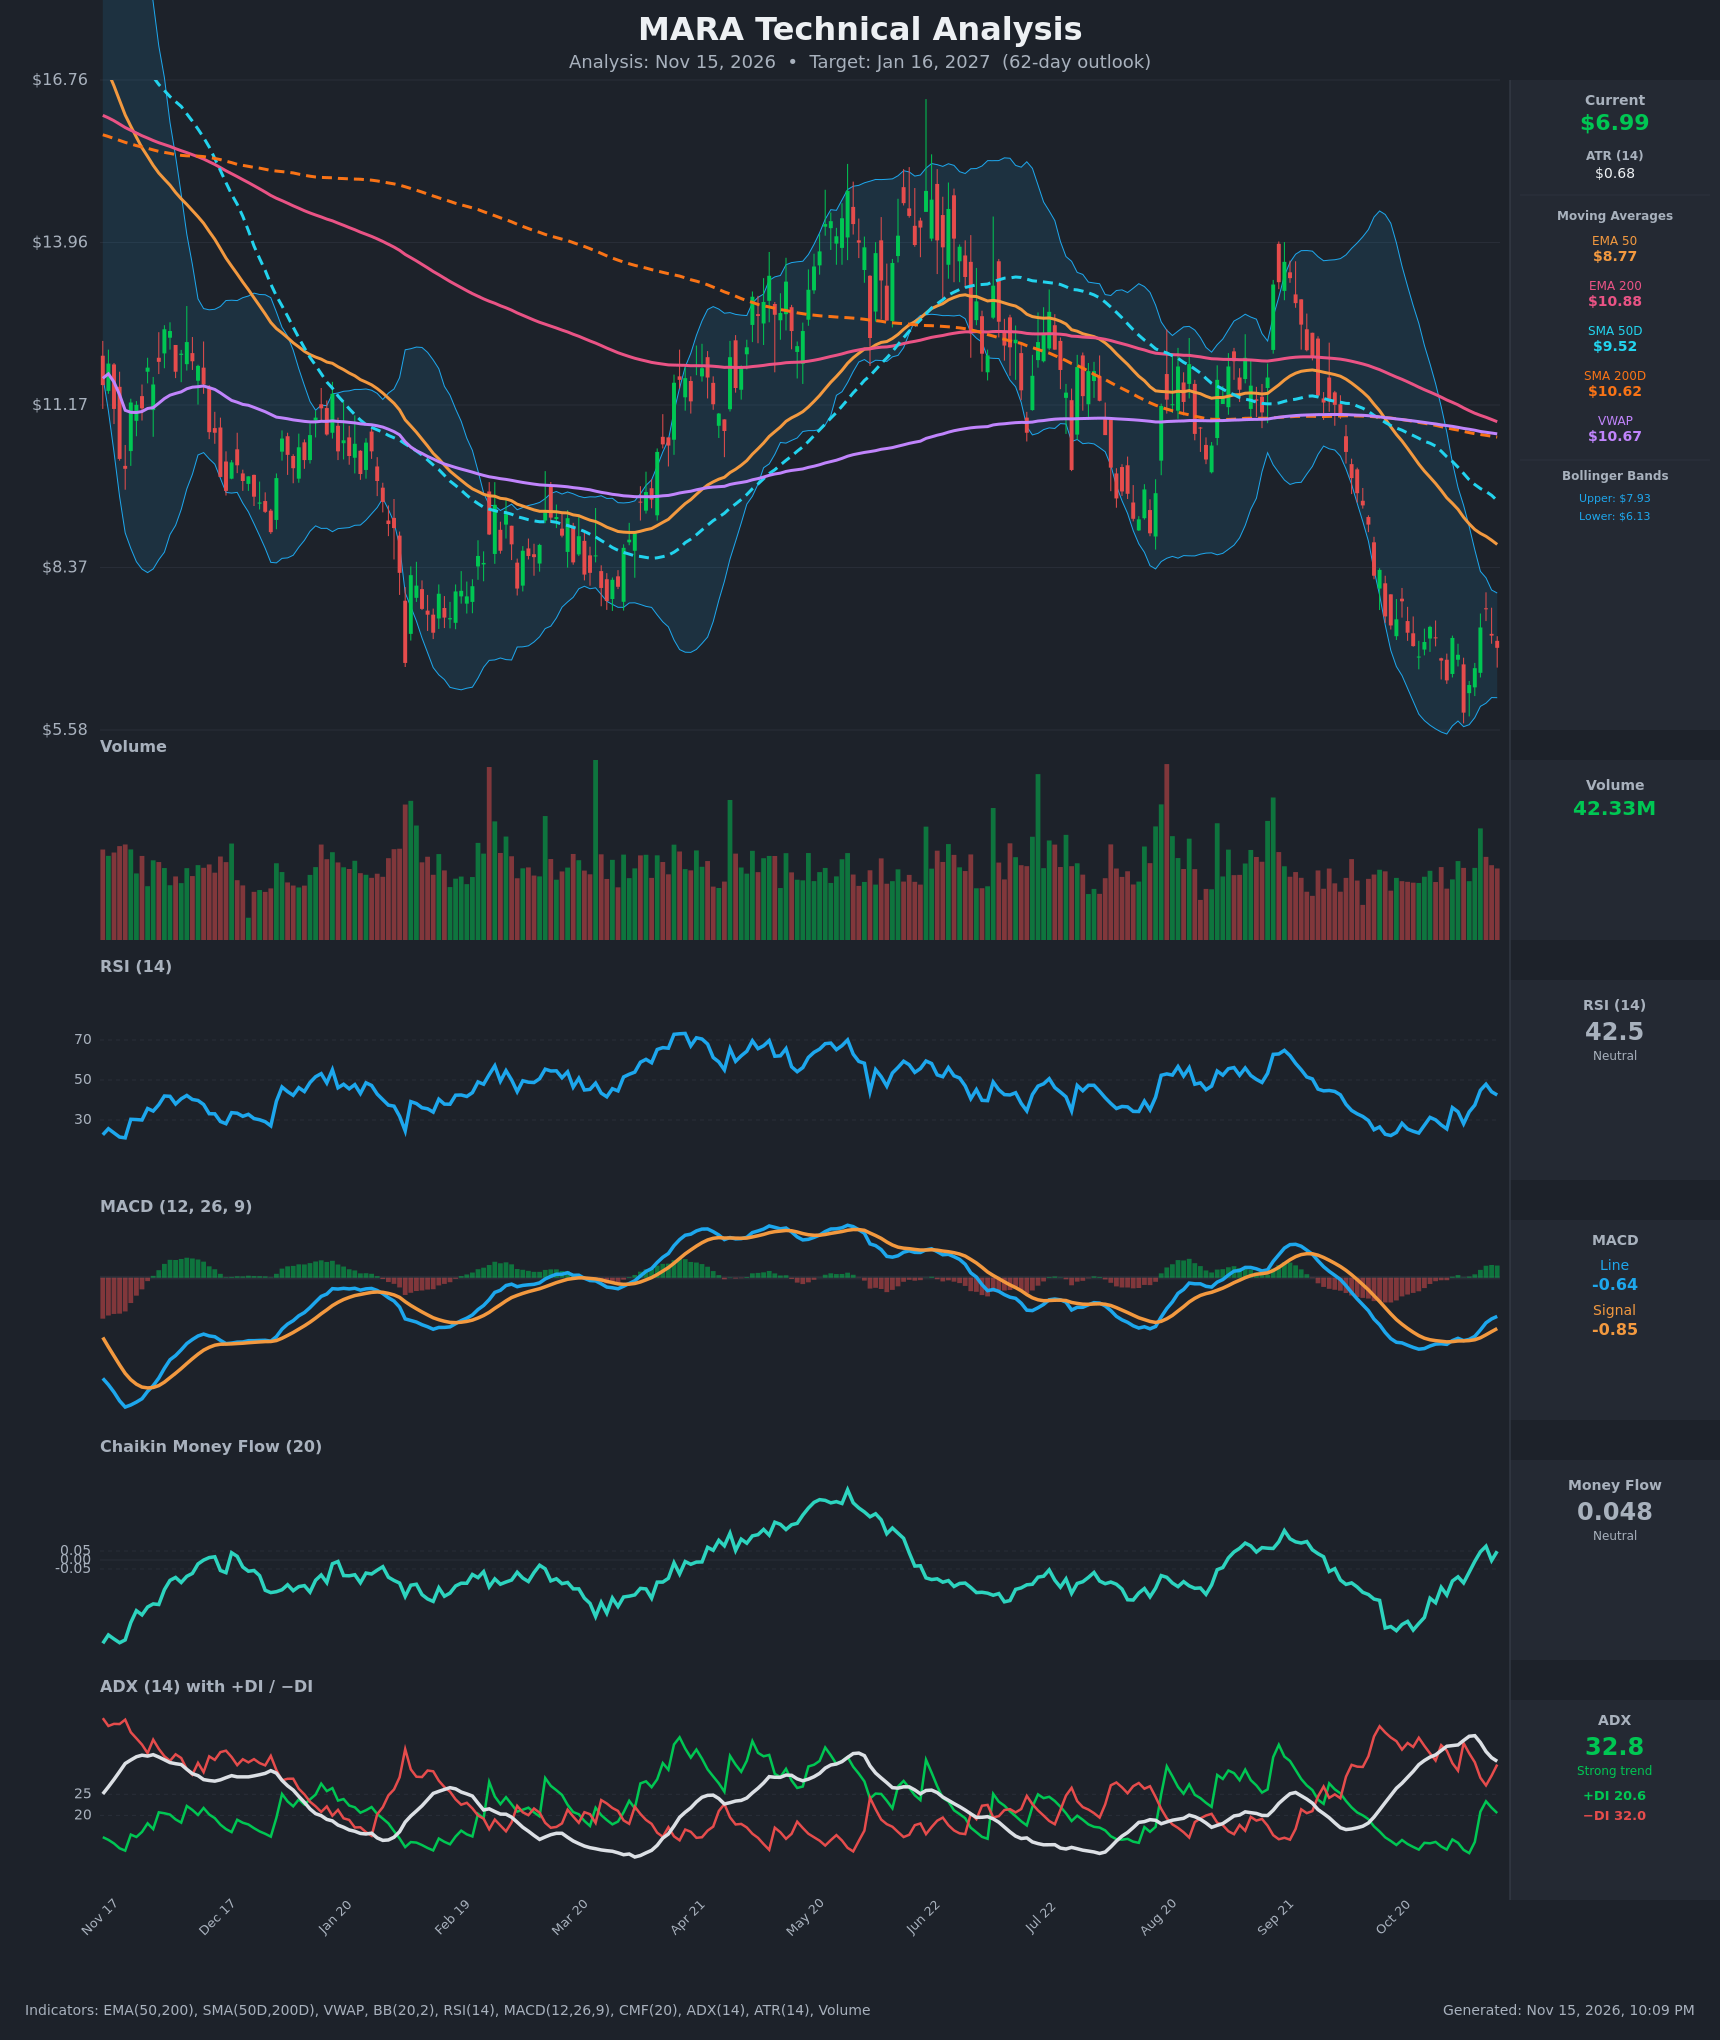
- RSI (14): 42.50, recovering from the 23.5 oversold low on Oct 26 and peaking at 47.9 on Nov 11. It is now rolling over slightly (47.9 → 44.1 → 42.5). It sits below the 50 midline, so momentum is still weak but has improved from the washout. [Neutral]
- 20 EMA / MAs: No 20 EMA was supplied, so the 50-period averages are used. Price at $6.99 is far below the EMA 50 ($8.77), SMA 50D ($9.52), EMA 200 ($10.88), SMA 200D ($10.62) and VWAP ($10.67). Every average slopes down and acts as overhead resistance. The nearest, the EMA 50, is about 25% above price. [Bearish]
- MACD: Line -0.643, signal -0.846, so the histogram is positive (about +0.20) and rising. The line crossed above the signal around Nov 3-10 from deeply negative territory. This is a bullish momentum crossover, but both lines are below zero, which is typical of a bounce within a downtrend. [Bullish]
- Bollinger Bands (20): Upper $7.93, lower $6.13, with price at $6.99 near the middle of the band. The earlier lower-band walk (the Nov 5 low of $5.88 pierced the band) has reverted to the mean. The bands are narrowing from their extreme width, which suggests the selling has cooled. [Neutral]
- CMF (20): 0.048, just under the +0.05 accumulation threshold. It has recovered from -0.352 on Oct 26 and has hovered around zero in the last few bars (0.076, -0.003, 0.048). Selling pressure has faded, but there is no decisive accumulation. [Neutral]
- ADX (14): 32.8, strong but falling from the 38.9 peak. −DI (32.0) is above +DI (20.6), so bears are still in control. +DI has risen from about 11 to 20, which narrows the gap and shows the downtrend losing some force. [Strong Trend – Bearish]
- Volume: 42.33M, in line with recent averages. There was no capitulation spike at the lows, and the bounce came on moderate volume. This does not confirm a durable reversal. [Neutral / unconfirmed]
DIVERGENCES & TRENDS
- Price made a lower low on Nov 5 ($5.88) while RSI (28.1) stayed above its Oct 26 low (23.5). MACD (-1.046 vs -1.188) and CMF also made higher lows. This is a mild bullish divergence that supports a relief bounce.
- The trend structure is bearish: lower highs and lower lows since the ~$13.5 peak in Sep. Price has fallen from about $13 to $7.
- Moving averages are stacked bearishly: EMA 50 < SMA 50D < SMA 200D < EMA 200 < VWAP. The SMA 50D is crossing below the SMA 200D (about $9.52 vs $10.62), a death cross that has just taken place.
- MACD has crossed bullishly, but price is making lower highs on the bounce (Nov 11 high of $7.66 against the Oct 28 high of $7.35, roughly flat) and is now rolling over.
- The ADX is falling from its peak with +DI rising, so the downtrend is maturing and a base is possible. A +DI/−DI crossover has not occurred.
CHART PATTERNS
- Primary pattern: Bearish Rising Wedge / Bearish Flag (continuation). After the sharp drop from about $12 to $6, the rebound from $5.88 forms a weak, overlapping bounce inside a downtrend. That points to continuation lower unless price reclaims about $7.70-$8.00. The measured-move target is roughly $5.00-$5.50.
- Alternative: Bullish Double Bottom. Lows near $5.88-$6.43 (Nov 2/Nov 5) with a neckline around $7.66 are forming a potential double bottom. A close above $7.70 would target roughly $9.40 (neckline plus pattern height). This is not yet confirmed.
- Price is close to the multi-year low area, which gives a decent base, but there is no confirmed reversal pattern.
POTENTIAL SCENARIOS
- Scenario 1: Bearish Downtrend Resumption — The bounce fades under the $7.66 high and the bearish structure (−DI dominance, price below all MAs) reasserts itself. Trigger: close below $6.40, then a break of the $5.88 low. Target: $5.50, with an extension to $5.00. Invalidation: daily close above $7.70. (45% probability)
- Scenario 2: Bullish Base and Relief Rally — The bullish divergence and MACD cross lead to a double bottom. Price breaks the $7.66 neckline and moves toward the EMA 50 at about $8.77. Trigger: close above $7.70 on rising volume with CMF above +0.05. Target: $8.50-$9.40. Invalidation: close below $6.13. (30% probability)
- Scenario 3: Neutral Range Consolidation — Price chops between $5.90 and $7.70 as ADX cools below 25. Trigger: failure to break either extreme. Target: $6.50-$7.30. Invalidation: close outside $5.80-$7.80. (25% probability)
PRICE TARGETS
For the 62-day window (target date around Jan 16, 2027):
- Target Price: $6.40 (below the current price; the bearish trend and MA overhead resistance outweigh the bounce signals)
- Expected Range: $4.95 to $7.90 (width $2.95, or about 42% of the current price, which is wider than the 18-30% guide for 61-180 days. It is justified by MARA's high volatility, with ATR of about 10% of price, and the two-sided risk between the $5.88 low and the $7.70 neckline. Over 62 days, 1-sigma is about ATR × √43 ≈ $4.4, so the range is on the tighter side and not excessive.)
- Key Levels: Support at $5.88, Resistance at $7.66
OVERALL BIAS
OVERALL BIAS: BEARISH - Price is below every major moving average, −DI dominates with ADX above 30, and a death cross has formed. The MACD cross and mild divergences point to a relief bounce, but they lack volume or CMF confirmation, so a retest of the $5.88 low is more likely than a sustained recovery.
This is educational analysis and not financial advice.