MARA 4-day bearish forecast — Nov 1, 2026
- Bias: Bearish
- Timeframe: 4 days (made Nov 1, 2026, target date Nov 4, 2026)
- Price at analysis: $6.76
- Price target: $6.65
- Expected range: $6.47 – $6.85
- Result: Incorrect (+2.0%) — closed at $6.90 on Nov 4, 2026; quality score 30/100
Get a free AI analysis of MARA today
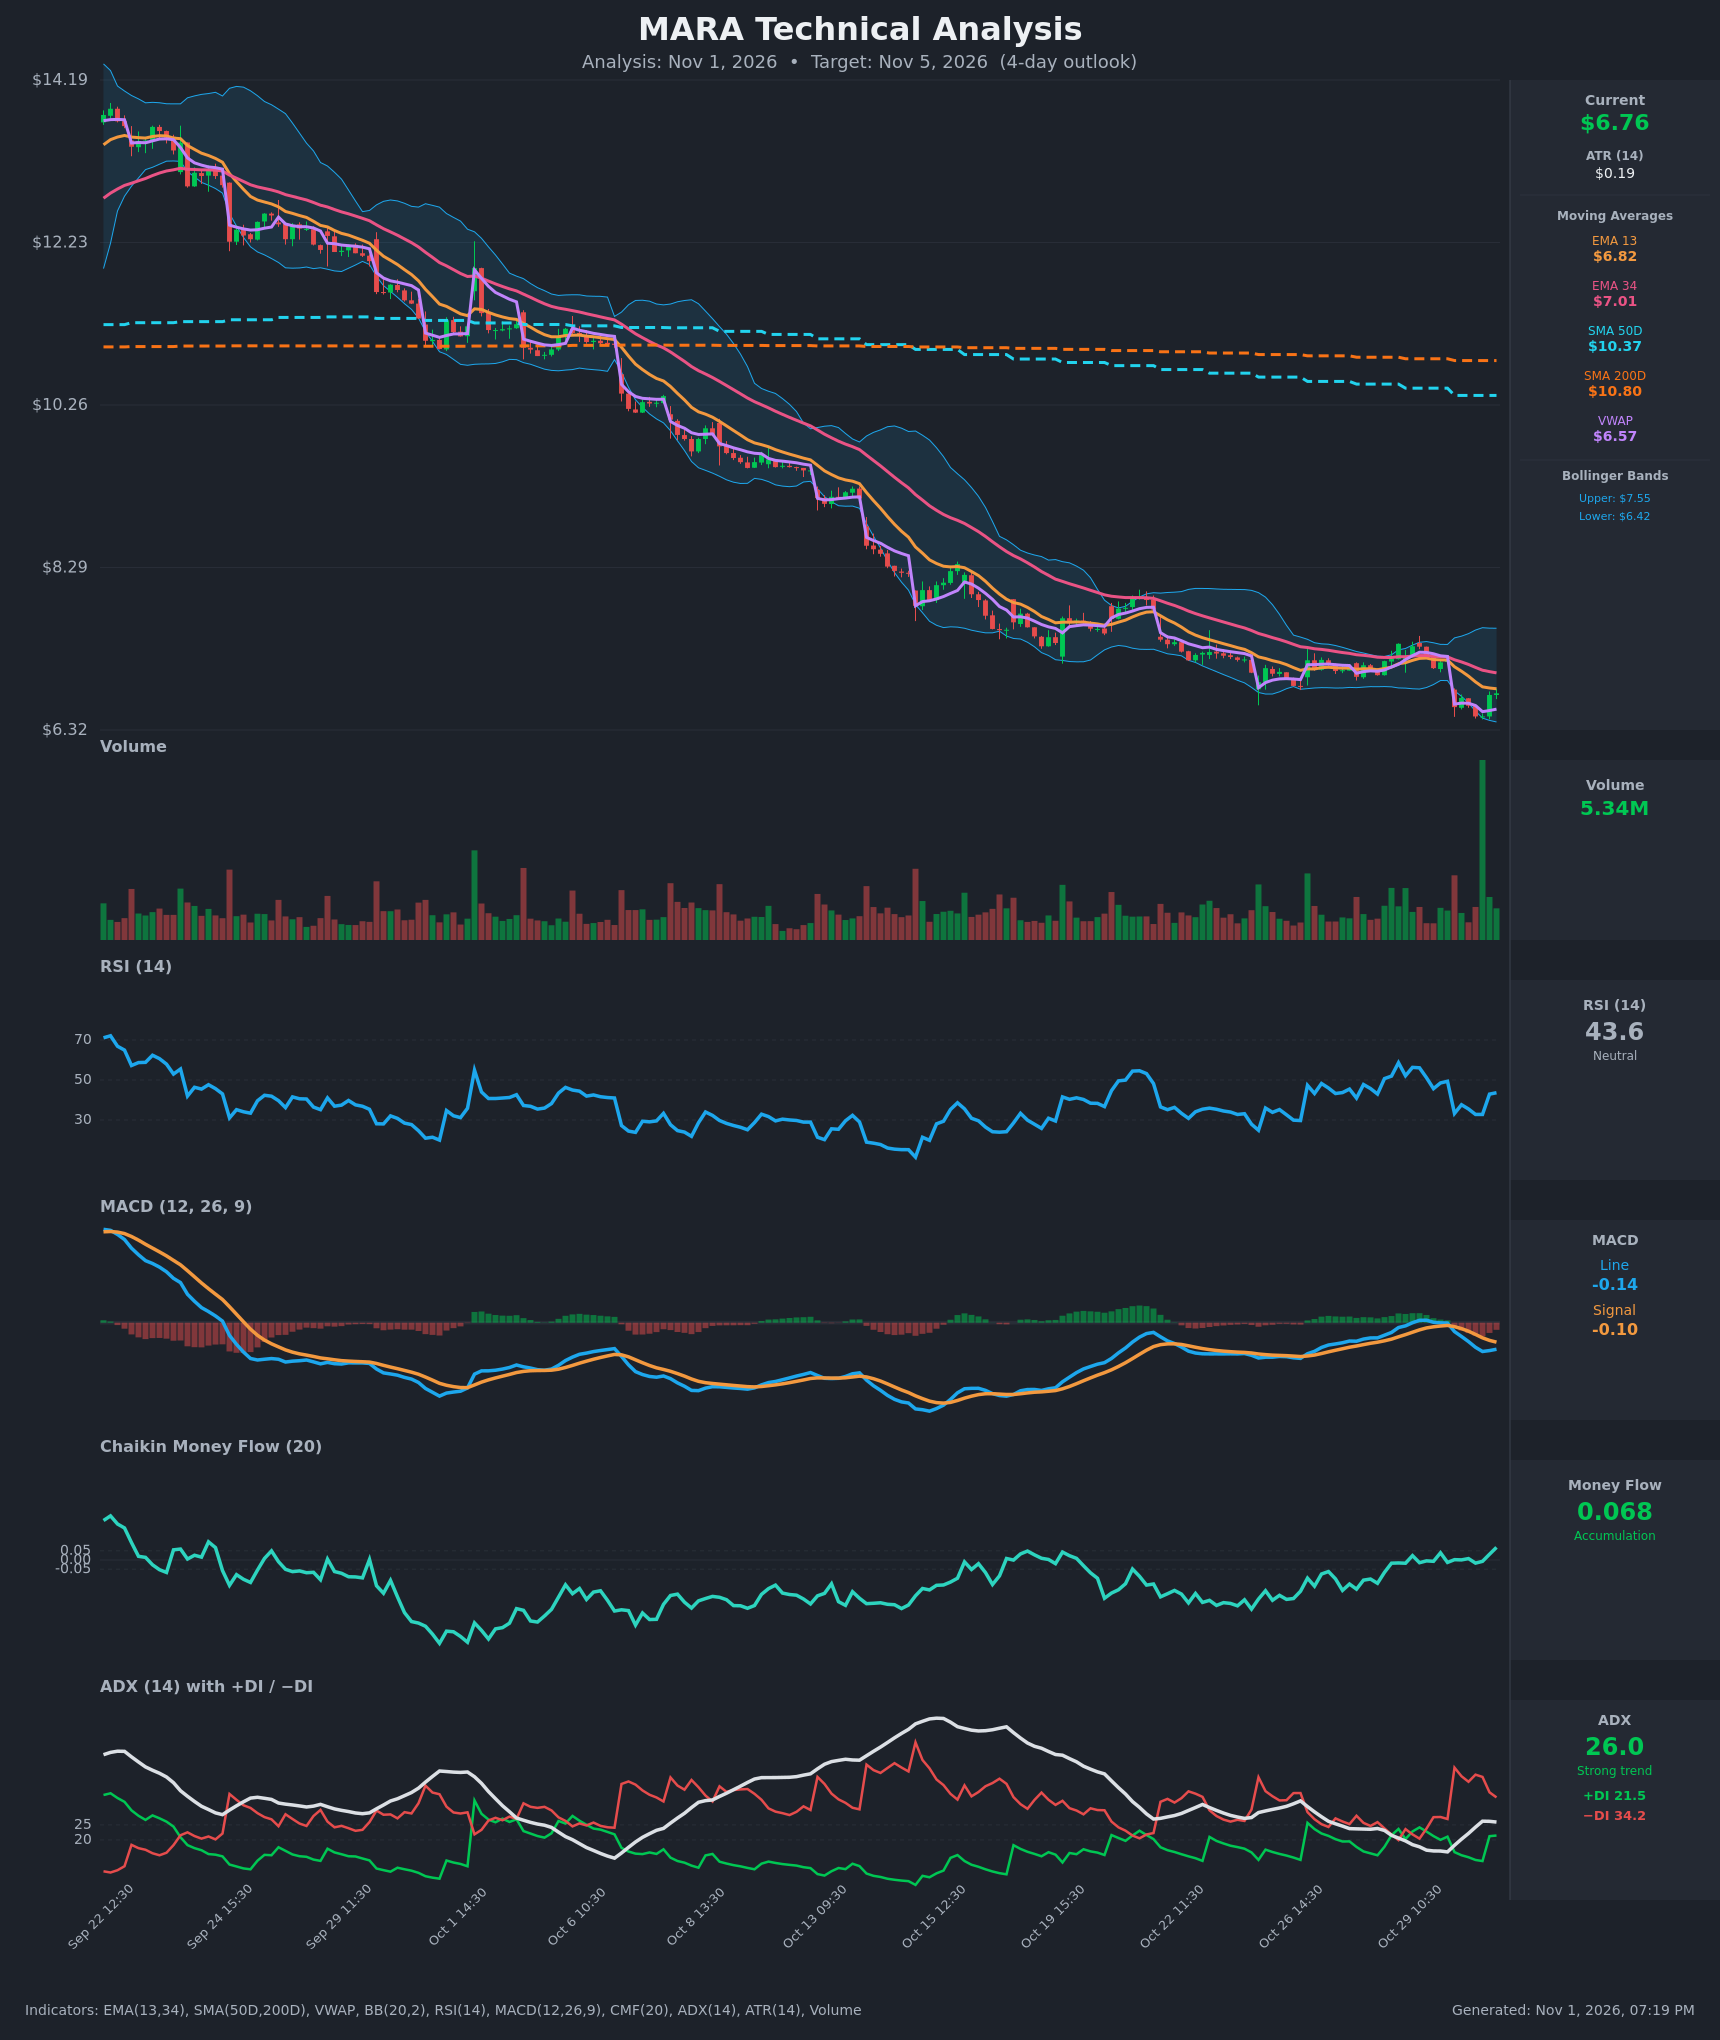
Analysis
TECHNICAL INDICATORS
- RSI (14): 43.64. It rebounded from oversold (~33) on Oct 30 but remains below 50, so momentum is still soft. The recovery is early and has not yet cleared the 50 midline. [Neutral]
- 20 EMA: The chart shows EMA 13 at $6.82 and EMA 34 at $7.01. Price at $6.765 is below both, so they act as resistance. EMA13 is below EMA34 and both are sloping down. [Bearish]
- MACD: Line -0.142 is below Signal -0.104, a bearish crossover that happened on Oct 30. Both lines are negative and the histogram is negative. The line has flattened slightly in the last two bars (-0.154 → -0.142), which hints at a little selling exhaustion. [Bearish]
- Bollinger Bands (20): Upper $7.55, lower $6.42, midline around $6.99. Price sits in the lower third after tagging the lower band, with the bands still expanding downward. The trend is down, but a bounce toward the midline is possible. [Bearish]
- CMF (20): 0.068 is above +0.05 and has turned up from around zero to slightly positive. This suggests some dip-buying or accumulation near the lows, which is the main bullish counterpoint. [Accumulation]
- ADX (14): 26.0 with −DI 34.2 above +DI 21.5. The trend is strong, with bears firmly in control. ADX is flattening and the DI spread has narrowed from its peak (44 vs 16). [Strong Trend - Bearish]
- Volume: 5.34M, with a large green volume spike on the final bars at the lows. It could be capitulation or a relief bounce. It has not yet produced follow-through above the EMAs. [Mixed / possible capitulation]
- Moving Averages (SMA/VWAP): SMA50D $10.37 is below SMA200D $10.80, so the death cross is already in place. Price is about 37% below both, which confirms a long-term downtrend. Price is slightly above VWAP ($6.57), a small intraday positive. [Bearish]
DIVERGENCES & TRENDS
- Price and RSI: Price made a new low while RSI (~33) was above its earlier oversold lows (~25 in mid-Oct). This is not a confirmed bullish divergence, but it shows downside momentum is weakening.
- CMF: It has risen from deeply negative to slightly positive while price kept falling, a mild bullish divergence. Accumulation is still unconfirmed by price.
- MACD: It crossed bearishly on Oct 30 and sits below zero. The line is curling slightly higher, but there is no bullish cross yet.
- ADX/DI: −DI has stayed above +DI on all but a few of the recent bars. The brief +DI spike during the bounce has faded.
- EMA/SMA structure: EMA13 is below EMA34, and both are far below SMA50D and SMA200D (death cross). The structure is fully bearish.
CHART PATTERNS
- Bearish continuation / breakdown: The Oct 22–29 consolidation near $7.0–$7.4 resembled a Bearish Flag or Pennant. It broke down with the Oct 30 gap to about $6.60, which fits a continuation pattern. The measured move points toward the $6.3–$6.4 area, matching the lower Bollinger Band and the chart low of $6.32.
- Possible Bullish Falling Wedge (larger scale): The persistent decline with contracting recent ranges could form a falling wedge. It is unconfirmed, needs a break above the EMA13/EMA34 (~$6.82–$7.01), and would target about $7.3–$7.5.
- Overall: The primary pattern is a downtrend continuation. Reversal patterns have not yet confirmed.
POTENTIAL SCENARIOS
- Scenario 1: Bearish Trend Continuation — Price is rejected at the EMA13 (~$6.82) and the −DI-dominated trend resumes, with MACD staying below its signal line. Trigger: failure at $6.82–$6.85, or a hourly close below $6.60. Target: $6.42 (lower BB), with an extension to $6.32. Invalidation: a sustained close above $7.01 (EMA34). (50% probability)
- Scenario 2: Bullish Relief Bounce — CMF accumulation and the high-volume capitulation bar fuel a short squeeze or mean reversion to the Bollinger midline. Trigger: a close above $6.82–$6.85 with RSI above 50. Target: $7.00–$7.20. Invalidation: a drop back below $6.55. (35% probability)
- Scenario 3: Neutral Chop — Price oscillates between the lower band and the EMAs without a decisive break. Trigger: ADX fading below 25. Target: $6.60–$6.85. Invalidation: a close beyond either $6.42 or $7.01. (15% probability)
PRICE TARGETS
- Target Price: $6.65 (4-day horizon, about -1.7% from $6.765)
- Expected Range: $6.47 to $6.85 (width $0.38, about 5.6% of current price, consistent with the 4-day timeframe)
- Key Levels: Support at $6.42, Resistance at $6.82
OVERALL BIAS
OVERALL BIAS: BEARISH - Price is below every moving average with a death cross in place. MACD is below its signal line and −DI (34.2) dominates +DI (21.5) with ADX above 25. Positive CMF and the lower-band bounce argue for a possible relief rally, so conviction is modest, but the evidence favors a rejection near the $6.82 EMA13 and a drift toward $6.4–$6.65.
This is educational analysis and not financial advice.