PFE 6-day bullish forecast — Nov 1, 2026
- Bias: Bullish
- Timeframe: 6 days (made Nov 1, 2026, target date Nov 6, 2026)
- Price at analysis: $30.50
- Price target: $30.85
- Expected range: $29.85 – $31.55
- Result: Incorrect (-3.7%) — closed at $29.39 on Nov 6, 2026; quality score 24/100
Get a free AI analysis of PFE today
Analysis
TECHNICAL INDICATORS
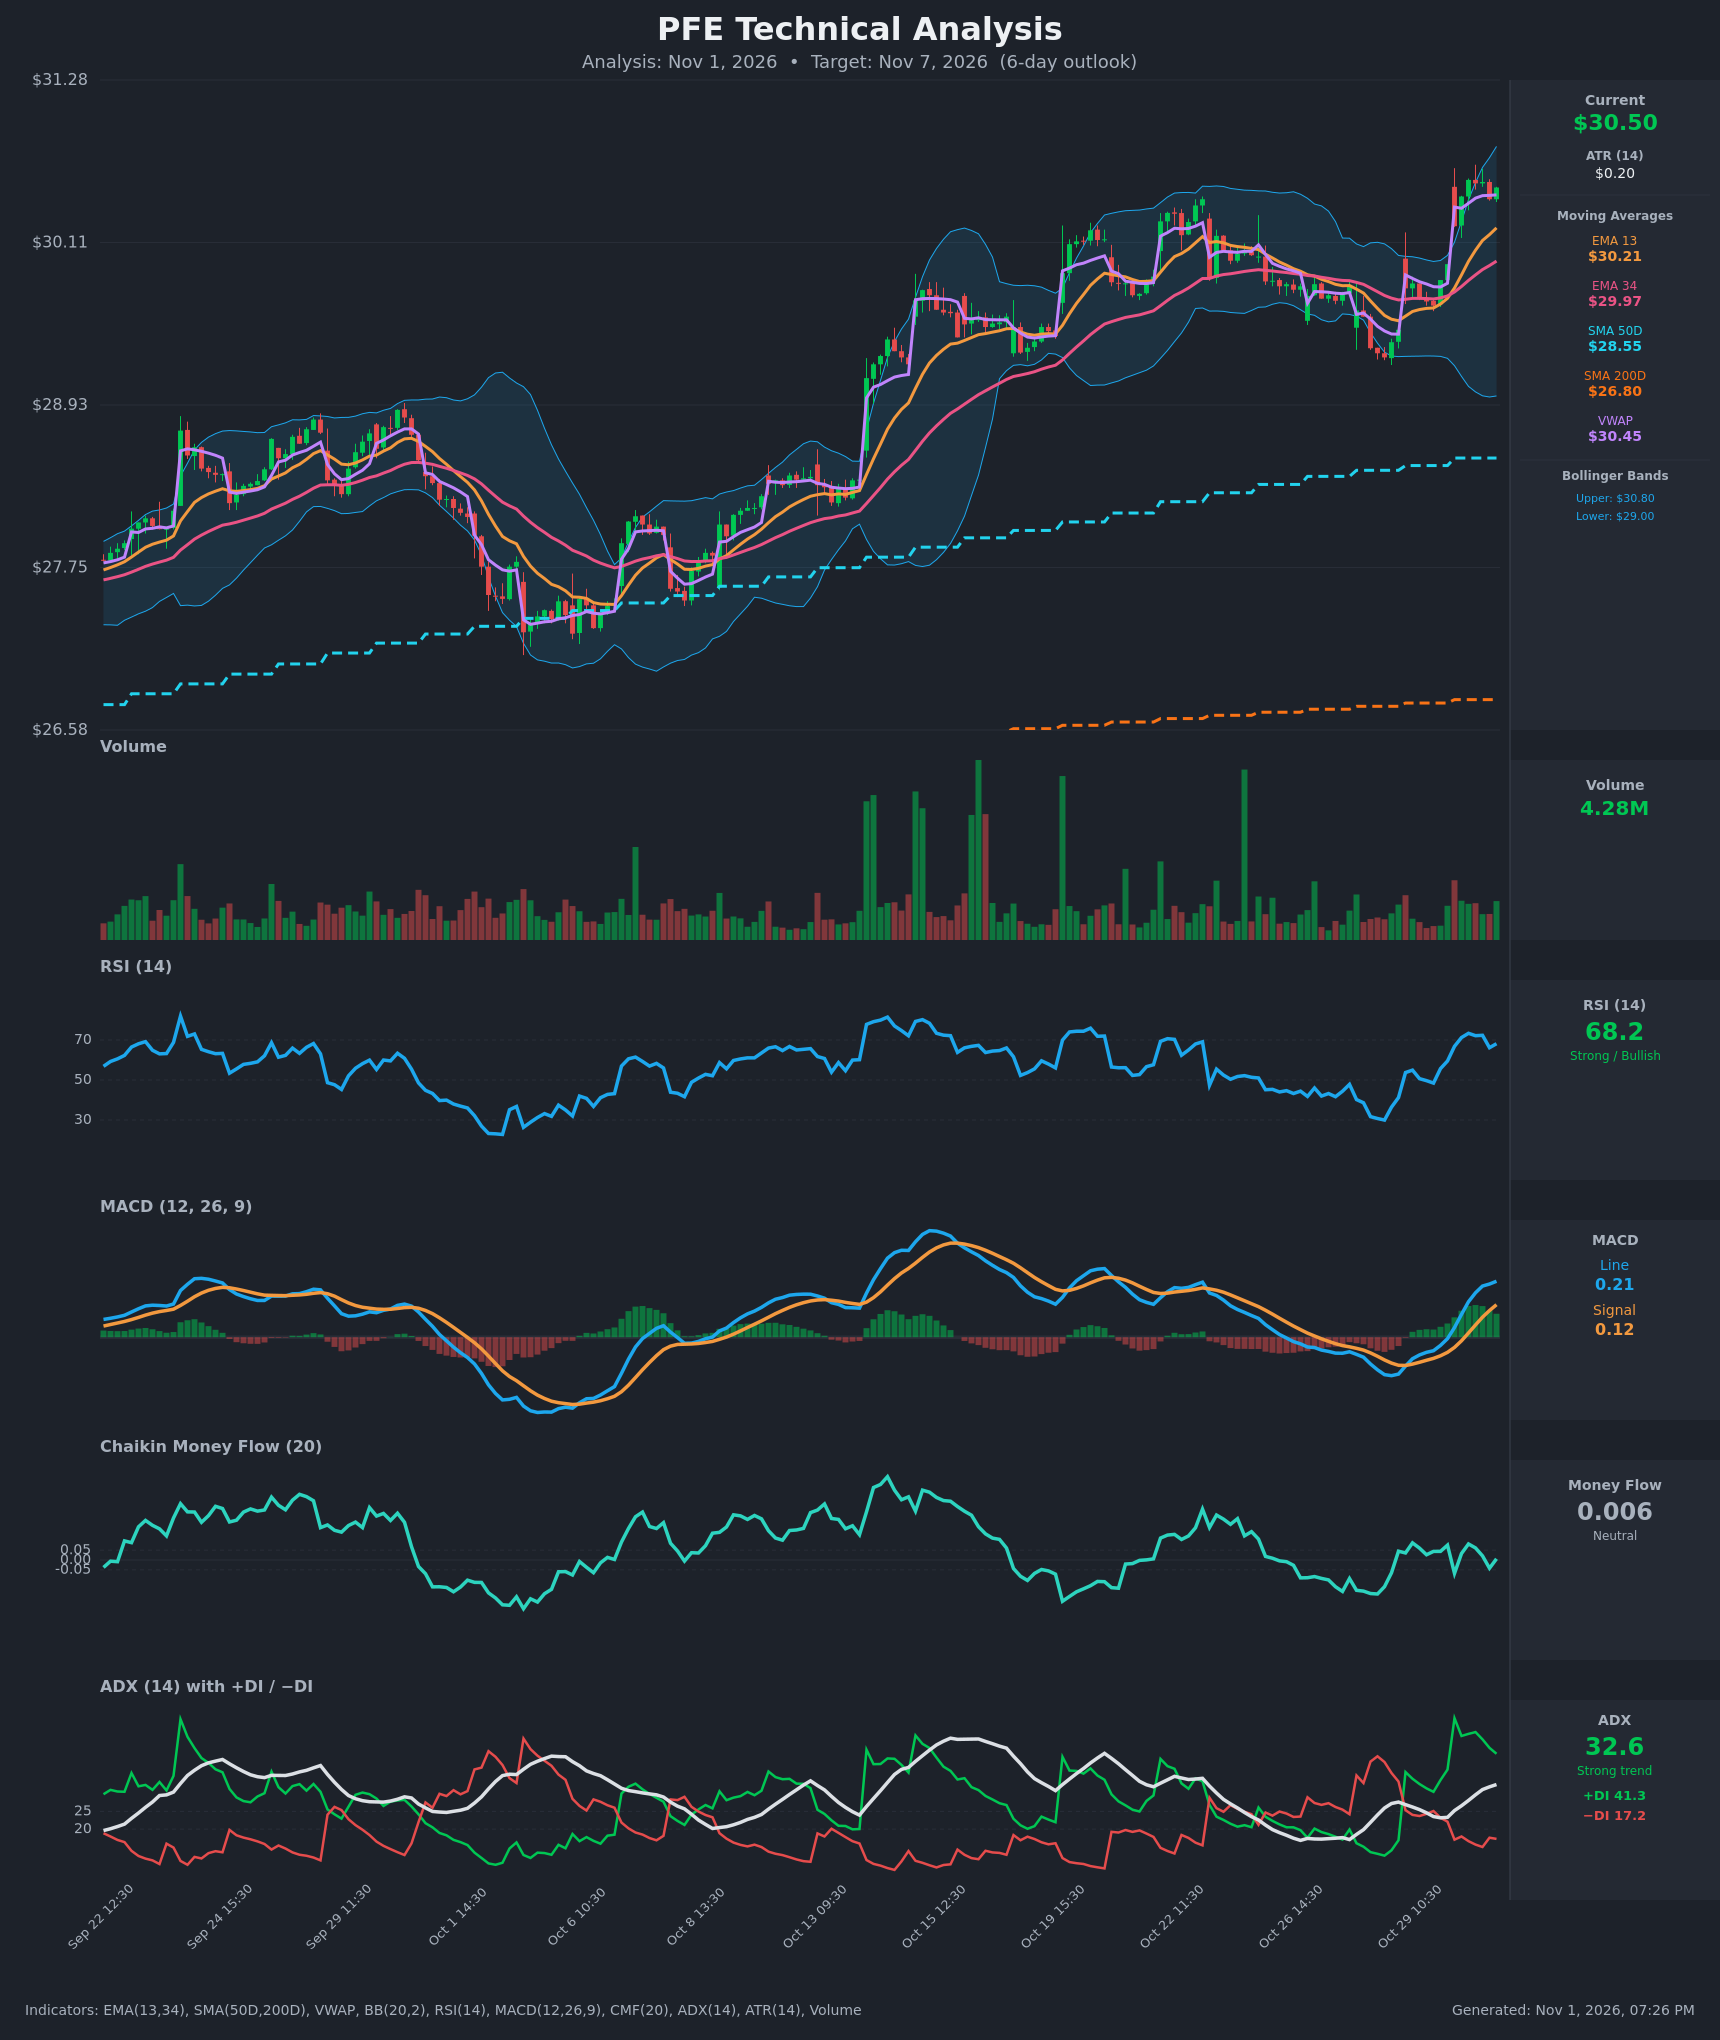
- RSI (14): 68.15, just under the 70 overbought line after peaking at 73.3 on Oct 30. It has climbed from about 30 on Oct 26-28, so momentum is strong, but it is near exhaustion and RSI has already rolled off its high intraday. [Bullish]
- EMA 13 / EMA 34 (the chart's "20 EMA" equivalent): Price of $30.51 is above EMA13 ($30.21) and EMA34 ($29.97). EMA13 is above EMA34, and the gap has widened over the last 15 bars (they crossed bullishly around Oct 30 morning). Price is also well above SMA50D ($28.55) and SMA200D ($26.80), and SMA50D is above SMA200D, so the long-term structure is a bullish uptrend. [Bullish]
- MACD: Line 0.210 is above Signal 0.122, with a positive and rising histogram. The line crossed above the signal on Oct 30 and has accelerated above zero since. [Bullish]
- Bollinger Bands (20): Upper $30.80, lower $28.996, with price at $30.51 in the upper quarter of the band (about 83% of the band width). The bands are widening after the breakout gap. Price is "walking" the upper half but has not yet closed above the upper band. [Bullish]
- CMF (20): 0.006, which is neutral (between -0.05 and +0.05) and oscillating around zero. The rally has not been matched by accumulation, which is a mild warning. [Neutral]
- ADX (14): 32.6 and rising, a strong trend. +DI (41.3) is far above −DI (17.2), so bulls are firmly in control, though +DI has slipped from its 51 peak. [Strong Trend – Bullish]
- Volume: 4.28M, around average with no standout spike. The gap-up bar on Oct 30 had better volume than the following consolidation bars, so confirmation is only moderate. Price is above VWAP ($30.45) by a thin margin. [Neutral to Mildly Bullish]
DIVERGENCES & TRENDS
- No bearish RSI divergence on the chart. Price is making higher highs and RSI is near 68-73, which is below its early-October peak of about 78, a slight loss of relative momentum but not a true divergence.
- CMF is flat near zero while price has risen about 3.5% in two days. That is a mild volume-flow disagreement and suggests the move is not backed by heavy buying.
- MACD turned up from below zero (about -0.14) to +0.21 in about 3 days, a sharp momentum swing. A bullish MACD cross, a bullish EMA13/34 cross and +DI dominance all agree.
- The ADX rebounded from about 23 to 32.6, so a new trend leg is underway.
- Price is stretched above EMA13 by about $0.29 (roughly 1.5 ATR), which raises the odds of a pause or pullback toward EMA13 or VWAP.
CHART PATTERNS
- Breakout from a consolidation / Bullish Flag-type structure: From Oct 22 to Oct 29 price drifted down and sideways in a falling channel (the lower highs from $30.2 to $29.4). The Oct 30 gap-up broke out of that channel, which matches the Bullish Flag Pattern from the reference. The measured move is roughly the pole (about $1.4-$1.8) added to the breakout, which points to an extended upside of $31.3-$31.8, though the 6-day view is more conservative.
- Resistance: The previous swing high is near $30.5-$30.6, and the upper Bollinger Band is at $30.80. The chart's top gridline is $31.28. Price is currently testing this zone, so a short stall is plausible (a small ascending-consolidation or retest).
- No reversal pattern (double top, head and shoulders) is evident.
POTENTIAL SCENARIOS
- Scenario 1: Bullish Flag Breakout Continuation — Price holds above EMA13 and VWAP, clears $30.80 (upper Bollinger Band) and extends the trend with ADX above 30. Trigger: close above $30.80 on rising volume. Target: $31.20-$31.50. Invalidation: close below $30.20 (EMA13). (50% probability)
- Scenario 2: Neutral Consolidation Near Highs — Overbought RSI and flat CMF lead to 2-4 days of chop between VWAP and the upper band, followed by a drift higher or flat. Trigger: failure to close above $30.80, with price rotating around $30.20-$30.80. Target: $30.40-$30.70. Invalidation: close above $30.90 or below $30.00. (28% probability)
- Scenario 3: Bearish Pullback / Mean Reversion — Exhaustion at resistance with RSI rolling over from 70 sends price back to the EMA34 and the gap area. Trigger: close below $30.20 with MACD histogram shrinking. Target: $29.75-$29.95. Invalidation: reclaim of $30.60. (22% probability)
PRICE TARGETS
- Target Price: $30.85 (6-day horizon, moderate continuation above the current $30.51)
- Expected Range: $29.85 to $31.55 (width $1.70, about 5.6% of price, consistent with the 4-8% guidance for a 6-day window)
- Key Levels: Support at $30.21 (EMA13), with deeper support at $29.97 (EMA34). Resistance at $30.80 (upper Bollinger Band), then $31.28.
OVERALL BIAS
OVERALL BIAS: BULLISH - A strong ADX (32.6) with +DI far above −DI, a fresh MACD crossover, a bullish EMA stack with price above both SMA50D and SMA200D, and a flag-style breakout all favor further upside. The main caveats are an overbought-leaning RSI near 68 and neutral CMF, which argue for a modest rather than aggressive target.
This is educational analysis and not financial advice.