PFE 4-day bullish forecast — Nov 1, 2026
- Bias: Bullish
- Timeframe: 4 days (made Nov 1, 2026, target date Nov 4, 2026)
- Price at analysis: $30.50
- Price target: $30.80
- Expected range: $29.90 – $31.35
- Result: Correct (+0.9%) — closed at $30.77 on Nov 4, 2026; quality score 100/100
Get a free AI analysis of PFE today
Analysis
TECHNICAL INDICATORS
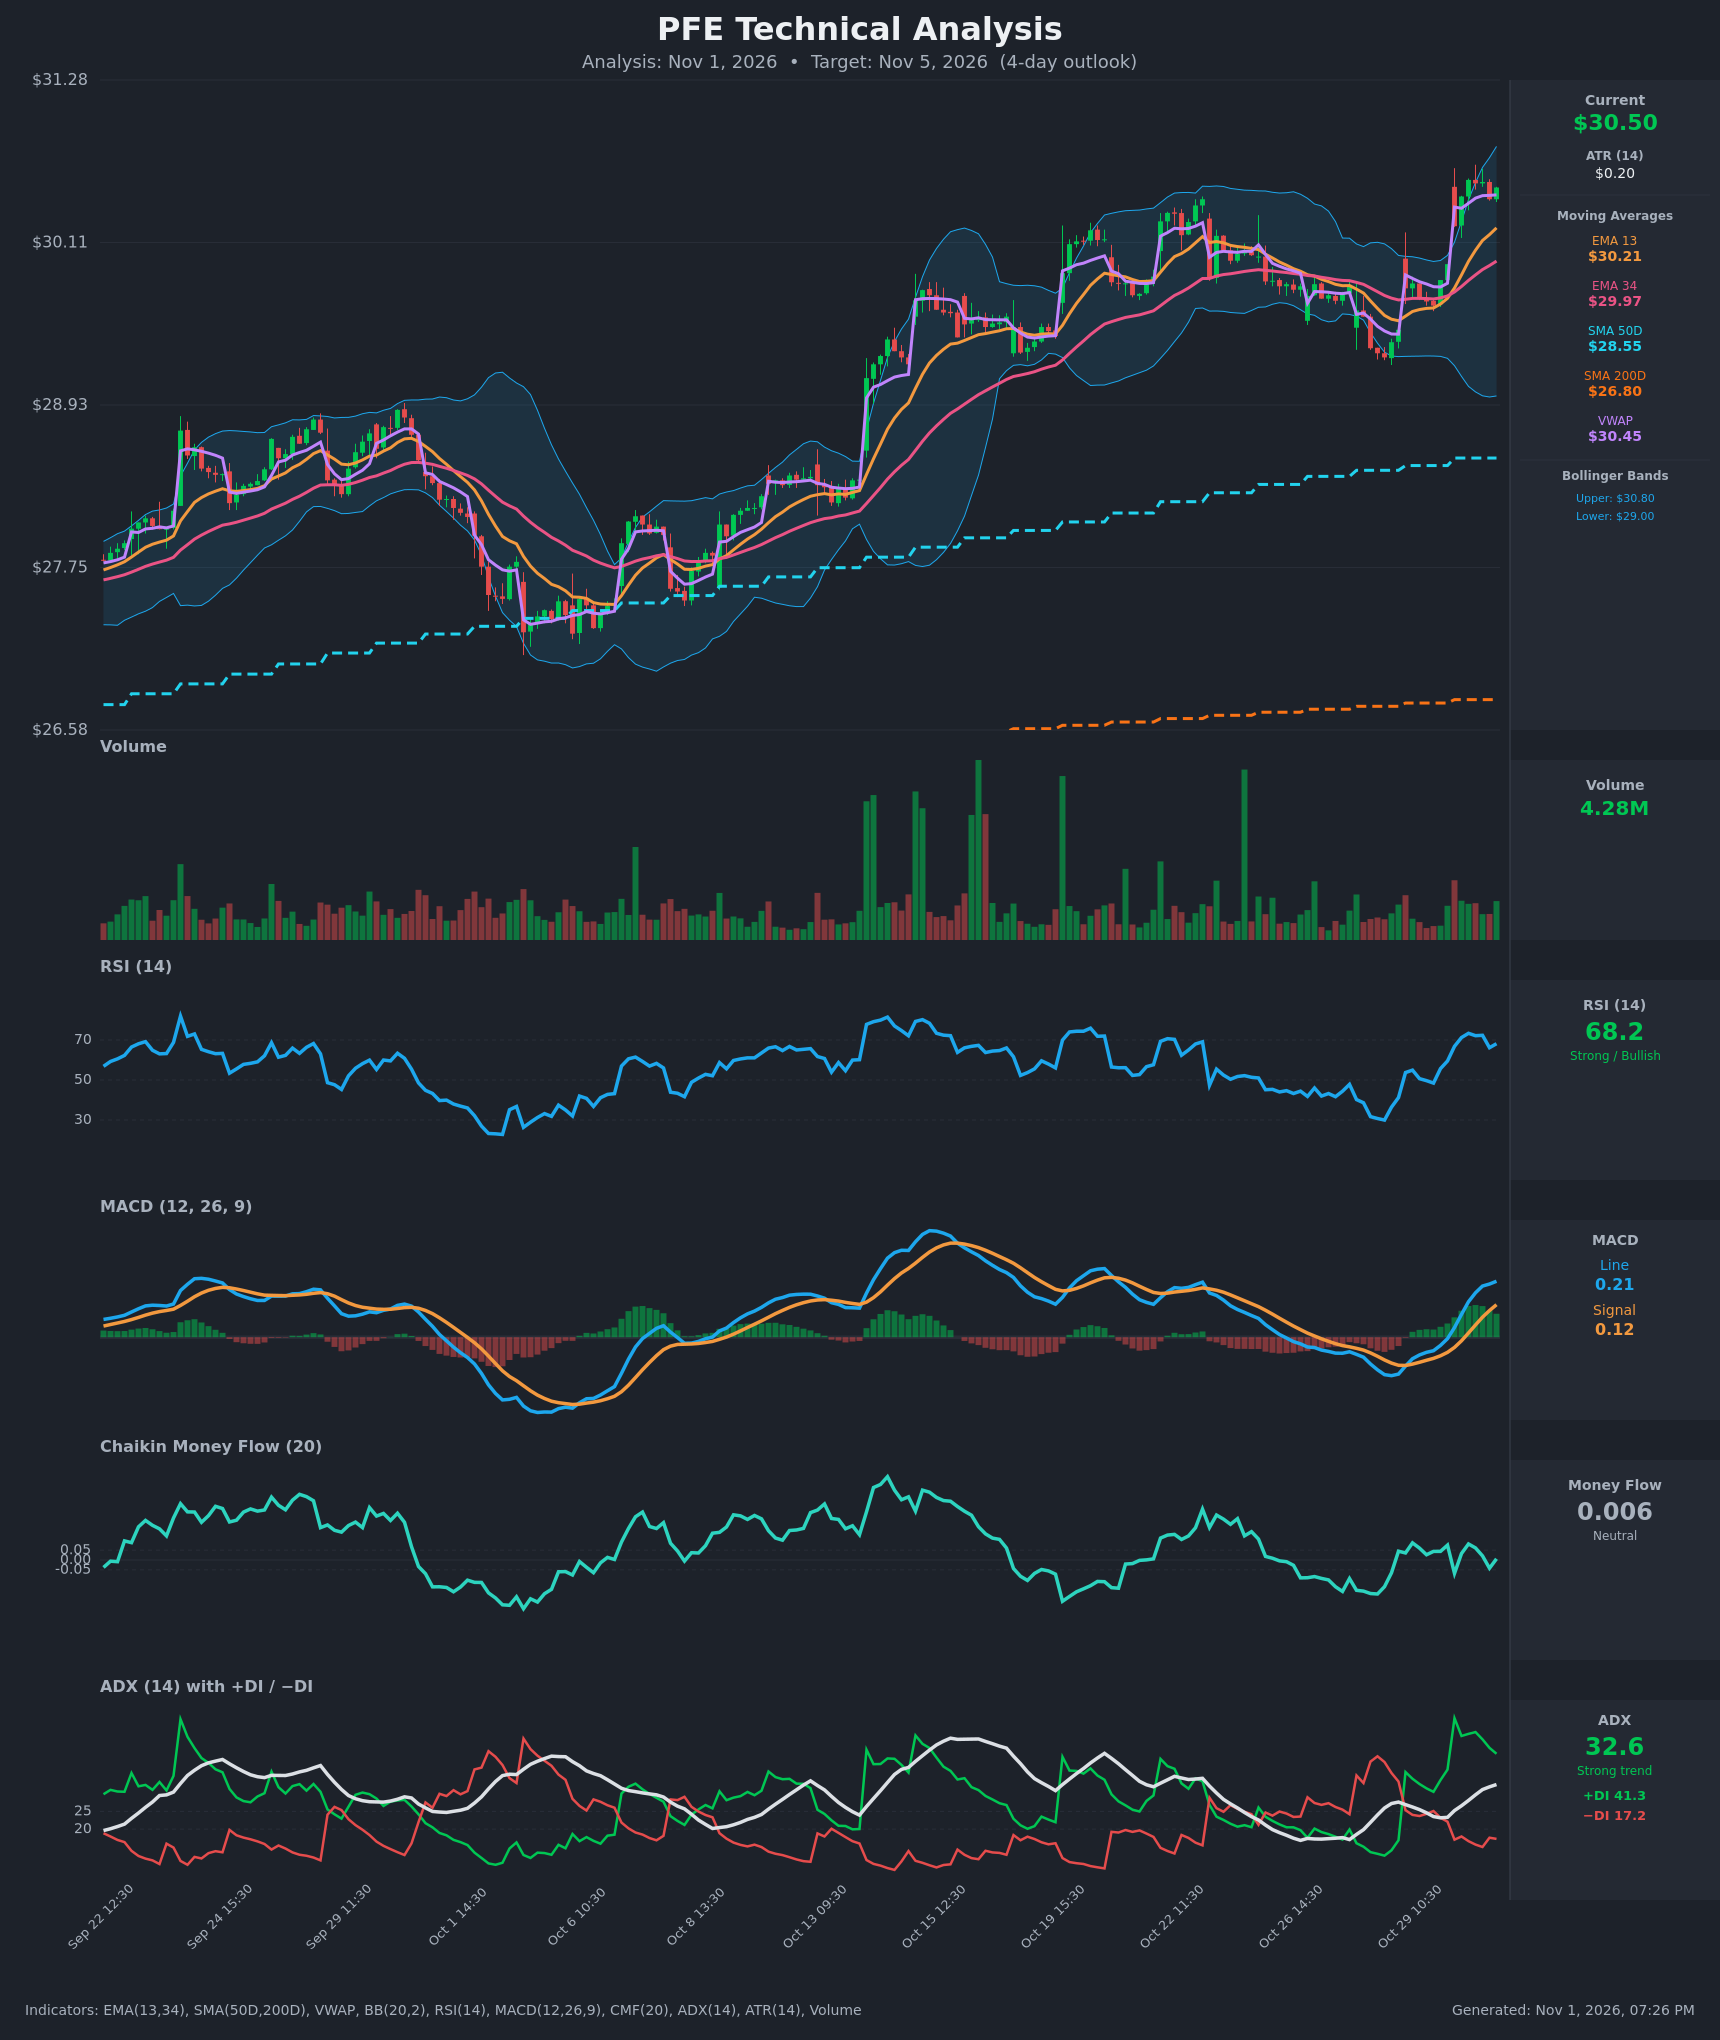
- RSI (14): 68.15, just under the 70 overbought line. It has climbed from about 30 on Oct 28 and peaked at 73.3 on Oct 30. It has since eased slightly, so momentum is strong but stretched. [Bullish]
- 20 EMA: No 20 EMA is supplied, so I use EMA 13 at $30.21 and EMA 34 at $29.97. Price ($30.51) is above both, and EMA13 crossed above EMA34 on Oct 30, which is a fresh bullish crossover. EMA13 is the first dynamic support. [Bullish]
- MACD: The line (0.210) is above the signal (0.122) after a bullish crossover on Oct 30. Both are now above zero and the histogram is positive and widening, which shows accelerating upside momentum. [Bullish]
- Bollinger Bands (20): Upper band $30.80, lower band $29.00, so price sits in the upper quarter of the band. The bands are widening after the gap-up, which suggests a volatility expansion with trend. Price has not closed outside the upper band, so there is still room to run, but the band is nearby resistance. [Bullish]
- CMF (20): 0.006, between ±0.05, and it has oscillated around zero in recent bars. Buying volume is not confirming the price advance, which is a mild caution. [Neutral]
- ADX (14): 32.6 and rising, above the 25 threshold, with +DI at 41.3 well above −DI at 17.2. Bulls are in clear control of a strong uptrend. [Strong Trend + Bullish]
- Volume: 4.28M, average to modest. The Oct 30 gap-up bar had decent participation, but the recent consolidation bars are on light volume with no volume surge confirming the breakout. [Neutral to mildly Bullish]
DIVERGENCES & TRENDS
- There is no clear bearish RSI or MACD divergence. Both made higher highs with price during the Oct 29-30 advance.
- CMF is flat near zero while price made new highs. This is a mild non-confirmation, not a true divergence.
- The trend structure is bullish. EMA13 > EMA34 > SMA50 ($28.55) > SMA200 ($26.80), and the SMA50 is above the SMA200, so the golden-cross structure is intact. Price is also above VWAP ($30.45), though only slightly.
- The ADX rose from 23 to 32.6, so trend strength is building. A +DI/−DI bullish crossover occurred on Oct 29.
- RSI has been around 72 and is now 68, so short-term momentum is cooling. This favors a pause or shallow pullback before any continuation.
CHART PATTERNS
- The gap-up on Oct 30 followed by tight sideways action near highs resembles a Bullish Flag/Pennant continuation pattern. The measured move from the pole (about $0.80 from $29.65 to $30.50) projects roughly $31.20-$31.30 on a confirmed breakout above about $30.60.
- On the larger scale, the staircase of higher highs and higher lows since Oct 28 forms an ascending structure, similar to an Ascending Triangle breakout from the Oct 22 range.
- The pattern is not fully confirmed. The overhead cap is the upper Bollinger Band at $30.80.
POTENTIAL SCENARIOS
- Scenario 1: Bullish Continuation Breakout — Price holds above VWAP/EMA13 and breaks the upper Bollinger Band as the strong ADX trend continues. Trigger: hourly close above $30.80. Target: $31.20-$31.30 (flag measured move). Invalidation: close below $30.20 (EMA13). (50% probability)
- Scenario 2: Neutral Consolidation Near Highs — Overbought RSI and neutral CMF cause a few days of sideways trading between VWAP and the upper band. Trigger: failure to close above $30.80 with light volume. Target: $30.30-$30.80 range. Invalidation: decisive break outside either side of that range. (30% probability)
- Scenario 3: Bearish Pullback — Profit-taking after the gap-up and RSI above 70 drags price back to support. Trigger: hourly close below $30.20. Target: $29.70-$29.95 (EMA34 / gap fill). Invalidation: reclaim of $30.60. (20% probability)
PRICE TARGETS
Range width check: $31.35 − $29.90 = $1.45, which is 4.75% of $30.505. This fits the 4-day timeframe (wider than a 2-3 day range, narrower than a 7-10 day range).
- Target Price: $30.80 (4-day target)
- Expected Range: $29.90 to $31.35
- Key Levels: Support at $30.20 (EMA13), Resistance at $30.80 (upper Bollinger Band)
OVERALL BIAS
OVERALL BIAS: BULLISH - A strong, rising ADX (32.6) with +DI far above −DI, a fresh MACD and EMA crossover, and price above every moving average and VWAP favor continuation. Overbought RSI and neutral CMF limit conviction and make a brief pause likely.
This is educational analysis and not financial advice.