ARM 13-day bearish forecast — Nov 1, 2026
- Bias: Bearish
- Timeframe: 13 days (made Nov 1, 2026, target date Nov 13, 2026)
- Price at analysis: $205.91
- Price target: $199.50
- Expected range: $190.00 – $209.00
- Result: Correct (-7.5%) — closed at $190.53 on Nov 13, 2026; quality score 96/100
Get a free AI analysis of ARM today
Analysis
TECHNICAL INDICATORS
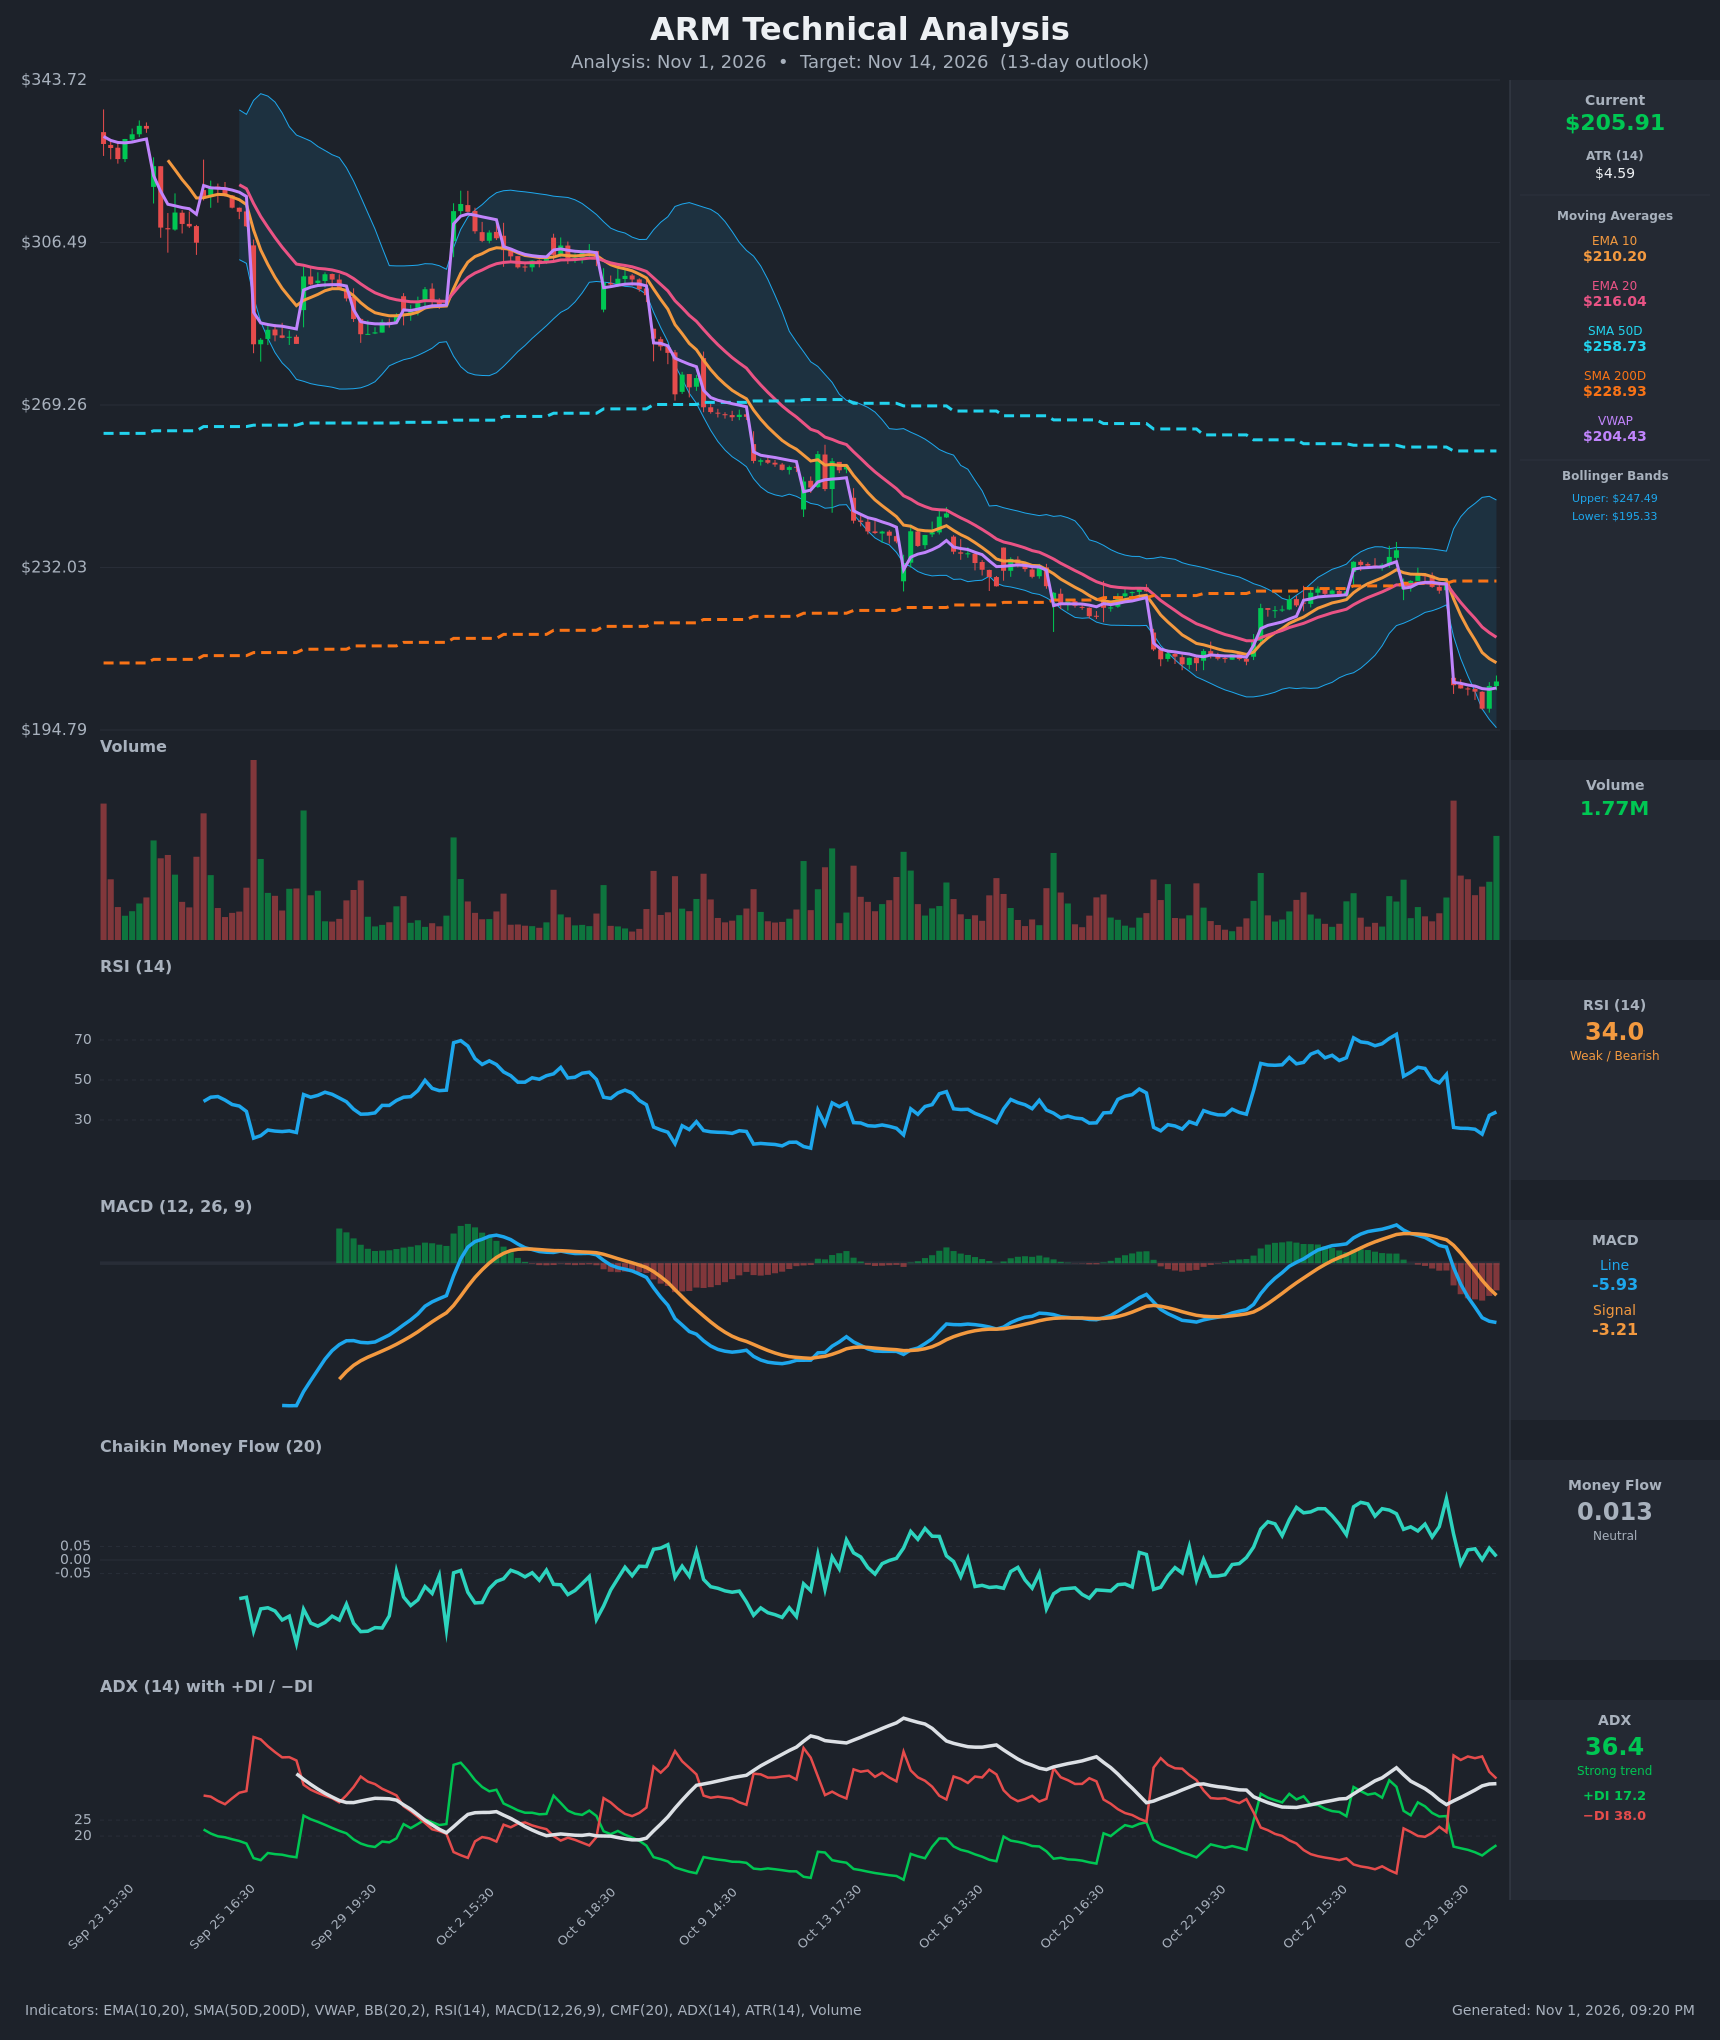
- RSI (14): 34.03, recovering slightly from the oversold low near 22.9 on Oct 30 (17:30). It is still below 40, in a bearish regime. Failure to reclaim 40-50 would keep momentum down. [Bearish]
- 20 EMA: $216.04, with the EMA 10 at $210.20. Price at $205.91 is below both, and both are sloping down steeply. EMA10 crossed under EMA20 around Oct 30 and is acting as resistance. [Bearish]
- MACD: Line -5.93 is below Signal -3.21. It crossed bearishly on Oct 30 (13:30), and the histogram is negative and widening. Momentum is accelerating down, not yet flattening. [Bearish]
- Bollinger Bands (20): Upper $247.49, lower $195.33. The bands are wide after the gap-down. Price at $205.91 sits in the lower quarter of the bands, having touched or pierced the lower band. That signals an extended move and possible short-term mean reversion, but not a reversal on its own. [Bearish]
- CMF (20): 0.013, between ±0.05. It has faded from the +0.1 to +0.2 range seen before the gap. Buyers did not defend the drop, but there is no heavy distribution yet either. [Neutral]
- ADX (14): 36.4, with −DI (38.0) well above +DI (17.2). This is a strong trend, and ADX is rising with bears firmly in control. [Strong Trend – Bearish]
- Volume: 1.77M on the latest bar. Volume spiked on the Oct 30 gap-down and stayed elevated, with a green bar at the end. That hints at some dip buying, but one bar does not change the trend. [Bearish with tentative stabilization]
Other moving averages and VWAP:
- Price is below the SMA200 ($228.93) and far below the SMA50 ($258.73). The SMA50 is still above the SMA200, so there is no death cross yet, but the SMA50 is rolling over.
- Price is just above VWAP ($204.43), a minor pivot.
DIVERGENCES & TRENDS
- There is no clear bullish RSI divergence. RSI made a higher low (about 25 on Oct 30 vs the lows near 25 earlier), but price made a lower low. That is only a mild sign of selling exhaustion.
- The Oct 22-29 rally was rejected near the SMA200 ($229) and the upper-band area. The failed reclaim of a major moving average is a bearish tell.
- The MACD bearish crossover, widening negative histogram and rising ADX with −DI dominant all point to a strengthening downtrend.
- A gap-down of about 10% (from $228.79 to $205.06) broke the Oct 22-29 base. The earlier lows near $205-207 were lost.
- RSI is bouncing from oversold, and price is hugging the lower Bollinger Band. This raises the odds of a relief bounce toward the EMA10/EMA20 ($210-$216) before the next leg lower.
CHART PATTERNS
- Bearish trend continuation / descending channel: Since early October, price has made a staircase of lower highs and lower lows below falling EMAs. Gap-downs have punctuated the decline.
- Failed base break (Bearish Rising Wedge / Flag-type logic): The Oct 22-29 advance was a rising recovery that broke down. Its measured move supports further downside, but the target is only a rough guide.
- Possible Bullish Falling Wedge or Double Bottom (low confidence): The gap-down low area near $199.7-$204 could form a double bottom if it holds on retest. It needs a close above about $216 (EMA20) to be credible.
POTENTIAL SCENARIOS
- Scenario 1: Bearish Trend Continuation — Sellers remain in control (−DI 38 vs +DI 17, ADX 36). A weak bounce stalls at the EMA10 ($210) and price resumes down, testing and breaking the lower Bollinger Band area. Trigger: rejection at $210-$212 or a close below $199.69. Target: $195 then $190. Invalidation: daily close above $216 (EMA20). (50% probability)
- Scenario 2: Bullish Oversold Relief Bounce — RSI turns up from oversold, the green volume bar signals dip buying, and price squeezes to fill part of the gap. Trigger: break and hold above $210.20 (EMA10). Target: $216 then $222-$229 (SMA200 zone). Invalidation: close below $199.69. (30% probability)
- Scenario 3: Neutral Consolidation — Price chops between roughly $199 and $212 as the gap-down is digested. Trigger: low volume and RSI flattening near 35-45. Target: $203-$208. Invalidation: close outside the $199-$212 range. (20% probability)
PRICE TARGETS
- Target Price: $199.50 (13-day horizon)
- Expected Range: $190.00 to $209.00 (width $19.00, about 9.2% of current price, consistent with a 13-day timeframe)
- Key Levels: Support at $195.33 (lower Bollinger Band), Resistance at $210.20 (EMA10), with further resistance at $216.04 (EMA20)
OVERALL BIAS
OVERALL BIAS: BEARISH - Price is below all key moving averages with a fresh MACD bearish crossover, ADX at 36 with −DI dominant, and a failed reclaim of the SMA200. A relief bounce from oversold is likely, but the path of least resistance remains lower.
This is educational analysis and not financial advice.